
August 2024 Weather and Its Impacts on Missouri
Dr. Pat Guinan |
Dr. Zachary Leasor |
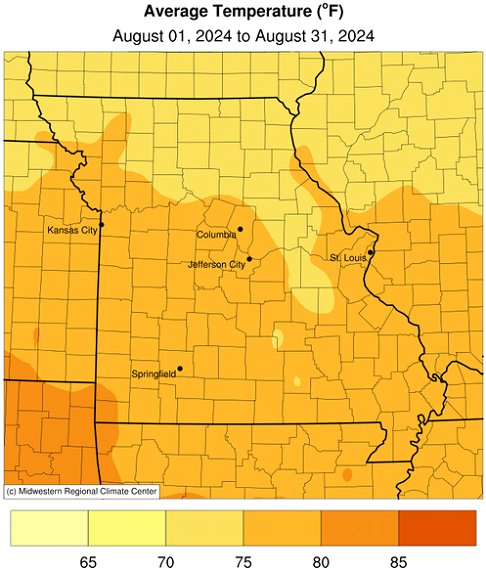
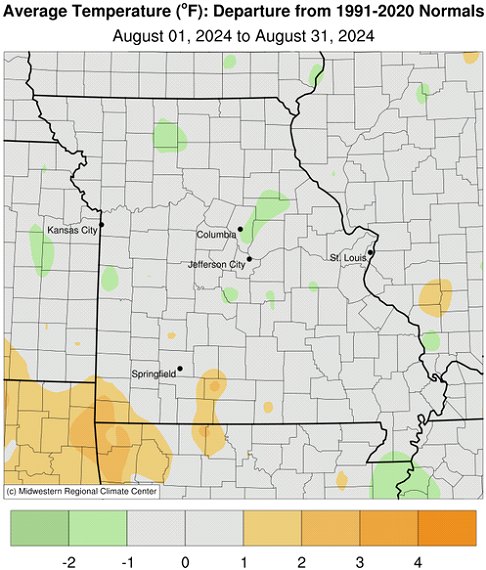
Slightly below average August temperatures impacted Missouri with preliminary data indicating a statewide average temperature of 75.7°F, or 0.3° below the long-term average, Figure 1. Hottest conditions occurred during the first and last week of the month with mostly below average temperatures during the second and third week of August, Figure 2. It was the second consecutive below average month for the summer period, Figure 3.
Preliminary mean summer temperature data (Jun-Jul-Aug) indicate slightly above normal conditions for Missouri, Figure 4. The statewide average summer temperature was 75.9°F, 0.4° above the long-term average. Above average June conditions offset slightly below average June and July weather to make it a marginally hotter than average summer.
Summer weather patterns over the past several decades indicate little change in maximum temperature trends, Figure 5, whereas minimum summer temperatures have been warming, Figure 6. This phenomenon is due, in part, to above average summer dew point temperatures in Missouri, Figure 7, which act to suppress maximum air temperature and elevate minimum air temperature.
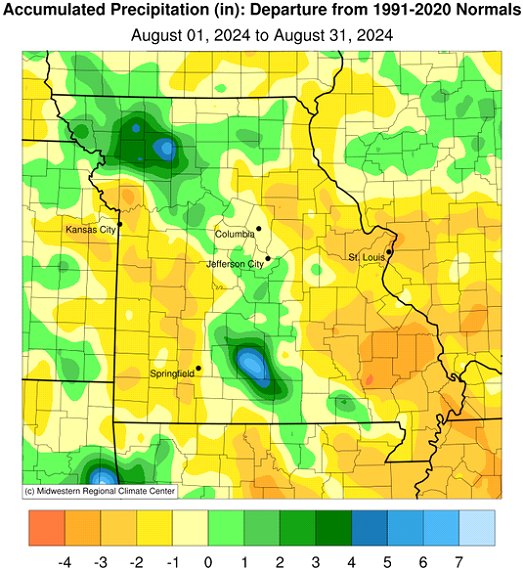
Below average rainfall impacted Missouri in August with preliminary data indicating a statewide average of 2.81 inches, 0.90 inches below the long-term average. It was the third drier than average month for the year, Figure 9.
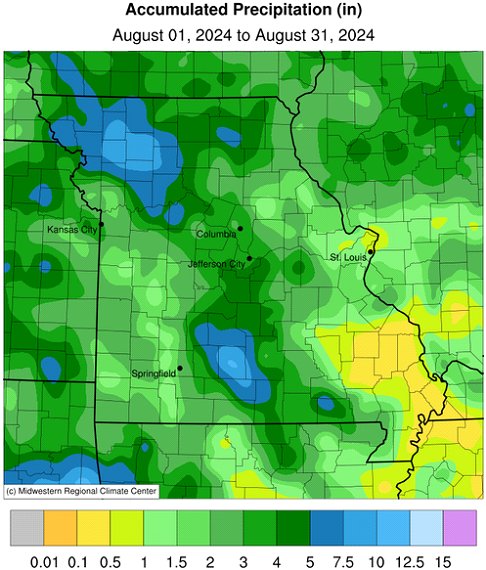
Typical of the summer season, August rainfall was highly variable, ranging from less than 1-inch to more than 10-inches, according to radar estimates, Figure 10. Much of eastern and parts of west central and southwestern Missouri received the lightest amounts while wettest conditions were located across south central and northwestern sections. Some of the lightest and heaviest August rain gauge totals are listed in Table 1.
The U.S. Drought Monitor map, for the week of August 27, 2024, indicated abnormally dry to moderate drought impacting portions of east central, southeastern, west central and southwestern Missouri, Figure 11. There were 36 Condition Monitoring Observer Reports submitted from Missouri in August, according to the National Drought Mitigation Center. The reports were mostly from southeastern and southwestern sections and agriculture related.
According to the Missouri Agricultural Statistics Service report for the week ending September 1, 2024, 70% of the state reported topsoil moisture supplies in adequate condition with 1% surplus, whereas 26% of Missouri reported short topsoil moisture supply and 3% very short. Subsoil moisture supplies were reported 76% adequate and 5% in surplus condition compared to 17% of the state reporting subsoil moisture supplies short and 2% very short. Corn was reported 79% in good to excellent condition compared to 32% last year. Soybean was reported 74% in good to excellent condition compared to 45% last year. Pastures were rated at 71% in good to excellent condition compared to 23% last year. Hay and other roughages were 18% surplus, 77% adequate, 5% short and 0% very short. Stock water supplies were 3% surplus, 89% adequate, 8% short and 0% very short.
| Missouri High and Low Rainfall Extremes for August 2024* | |||
| Station Name* | County | Rainfall (in.) | |
| Heaviest | |||
| Jamesport 1.3ESE | Daviess | 11.73 | |
| Hartville | Wright | 11.40 | |
| Cameron 6.7N | DeKalb | 10.71 | |
| Darlington 5.2S | Gentry | 9.80 | |
| St. Joseph 1.3NNW | Buchanan | 8.46 | |
| Cabool 3.6S | Texas | 8.45 | |
| Utica 0.1ESE | Livingston | 8.41 | |
| Cosby 1.2E | Andrew | 7.59 | |
| Kingston 0.1WNW | Caldwell | 7.52 | |
| Mountain Grove 14.0S | Douglas | 7.35 | |
| Lightest | |||
| Perryville Water Plant | Perry | 0.23 | |
| Greenville 5.2WNW | Wayne | 0.28 | |
| Marble Hill 6.8E | Cape Girardeau | 0.32 | |
| Scott City 0.9E | Scott | 0.39 | |
| Lesterville 2 | Reynolds | 0.52 | |
| Cottleville | St. Charles | 0.65 | |
| Urich 6.6SW | Bates | 0.66 | |
| Florissant 2.9W | St. Louis | 0.71 | |
| Table Rock Dam | Taney | 0.74 | |
| Mexico | Audrain | 0.77 | |
| *Rain gauges are from the NWS Cooperative Network or CoCoRaHS Observers. | |||
| Table 1. | |||
Jump to:
- Figure 1
- Figure 2
- Figure 3
- Figure 4
- Figure 5
- Figure 6
- Figure 7
- Figure 8
- Figure 9
- Figure 10
- Figure 11
- Figure 12
- Figure 13
- Figure 14
- Figure 15
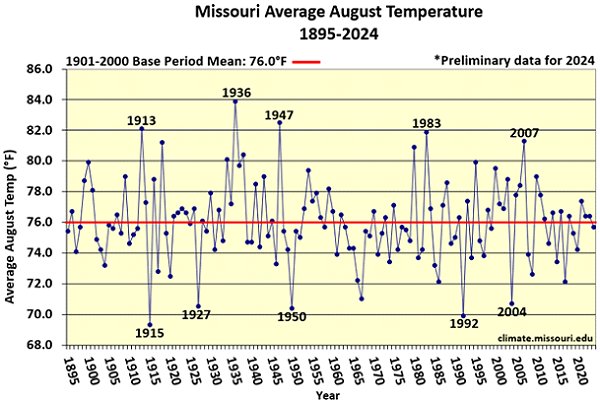
Figure 1.
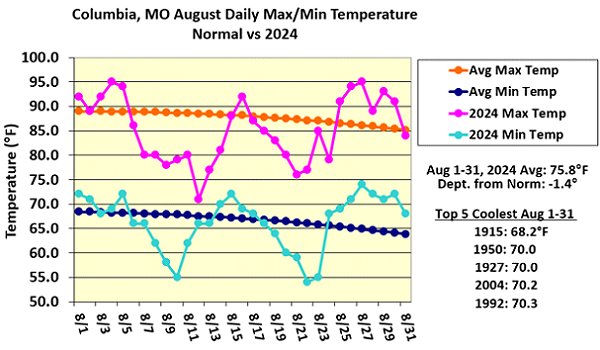
Figure 2.
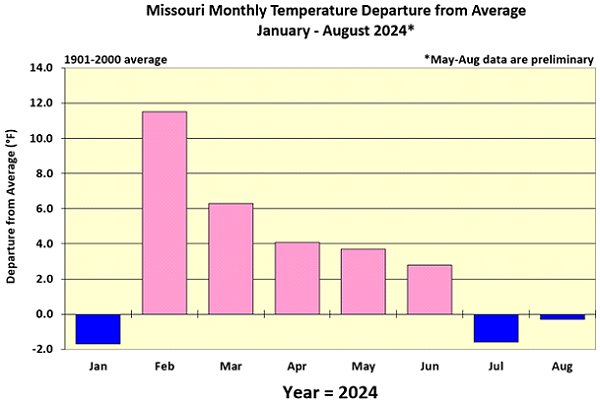
Figure 3.
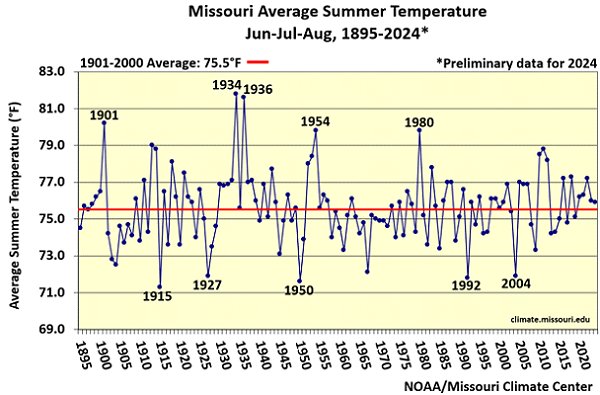
Figure 4.
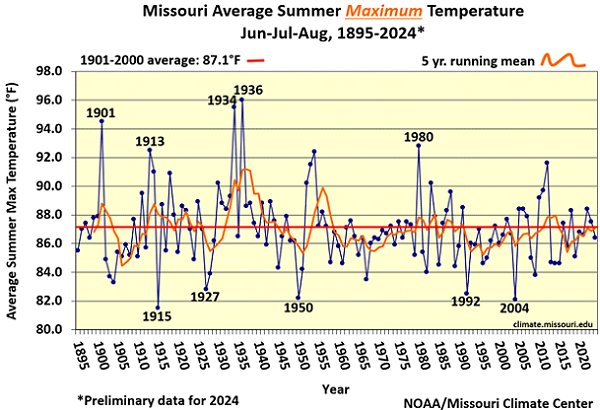
Figure 5.
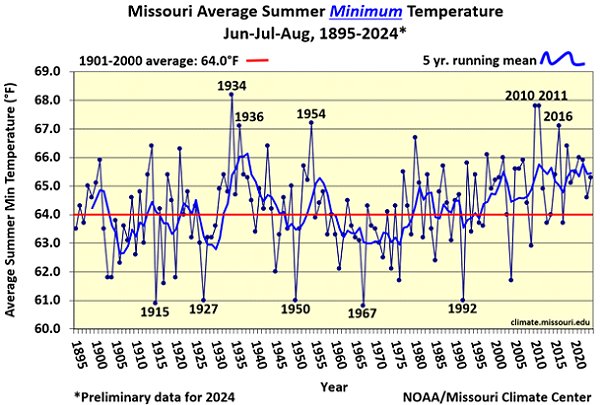
Figure 6.
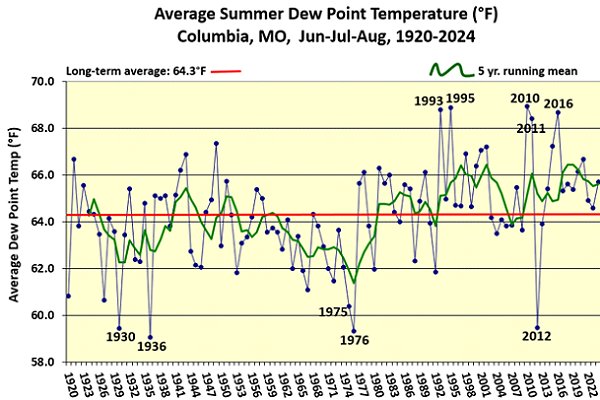
Figure 7.
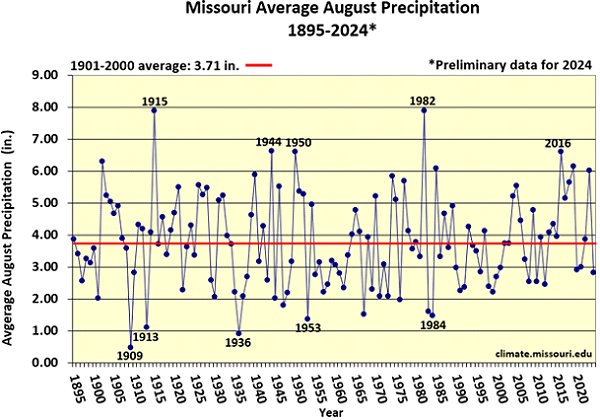
Figure 8.
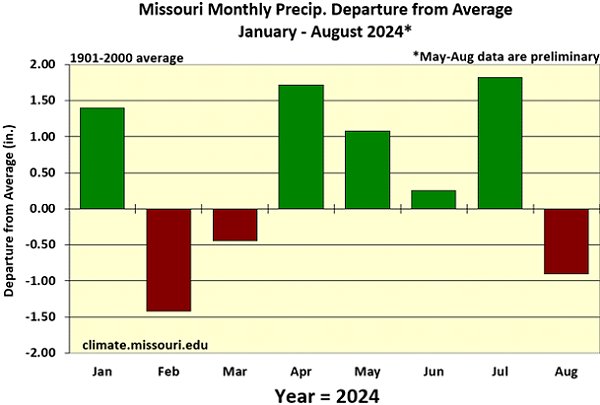
Figure 9.
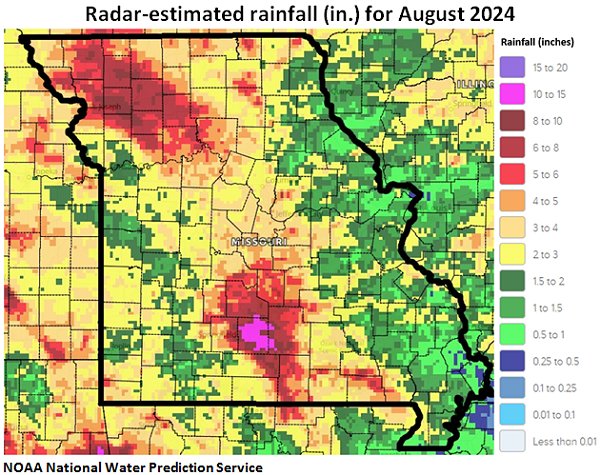
Figure 10.
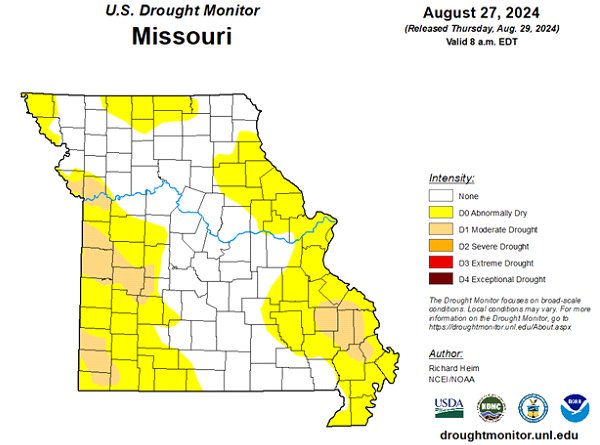
Figure 11.
Source: Dr. Pat Guinan and Dr. Zack Leasor | 573-882-5908