August 2021 Weather and Its Impacts on Missouri
Pat Guinan
State Climatologist
University of Missouri Extension
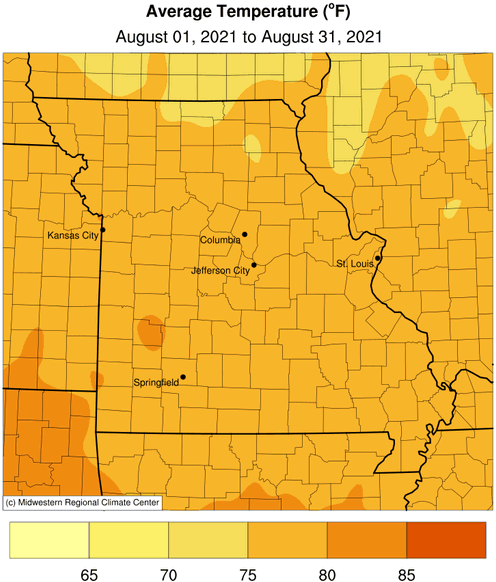
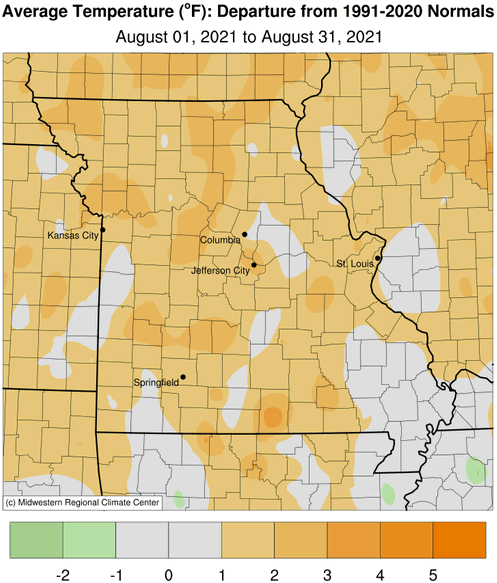
Above average daily August temperatures mostly impacted Missouri with preliminary data indicating a statewide average temperature of 77.5°F, or 1.5° above the long-term average. It was hottest August in a decade, Figure 1. Below average temperatures occurred during the first week of August and were followed by warmer than average conditions for much of the rest of the month, including several days with high temperatures in 90s and lows in the upper 60s and lower 70s, Figure 2. Most locations reported no triple-digit heat. August was the hottest month for the Jun-Jul-Aug summer period and it was the fourth warmer than average month for the year, Figure 3.
Daily summer temperatures this year reflected the overall trend of the past few decades, with no prolonged periods of extreme high temperatures. Preliminary mean summer temperature data (Jun-Jul-Aug) indicate slightly above normal conditions this year, Figure 4. The statewide average summer temperature was 76.3°F, 0.8° above the long-term average. Summer weather patterns over the past several decades indicate little change in maximum temperature trends, Figure 5, whereas minimum summer temperatures have been warming, Figure 6. This phenomenon is primarily due to above average summer dew point temperatures in Missouri, Figure 7, which act to suppress maximum air temperature and elevate minimum air temperature.
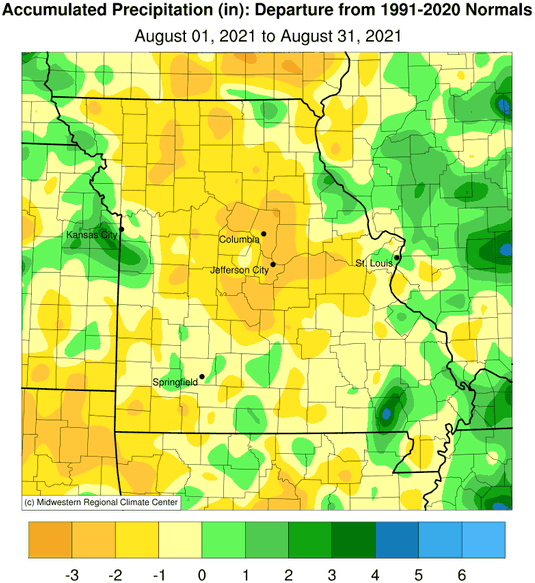
Drier than average weather impacted Missouri in August with preliminary data indicating a statewide average of 3.02 inches, 0.69 inches below the long-term average. It was the second consecutive drier than average August, Figure 8, as well as the second below average month for the year, Figure 9.
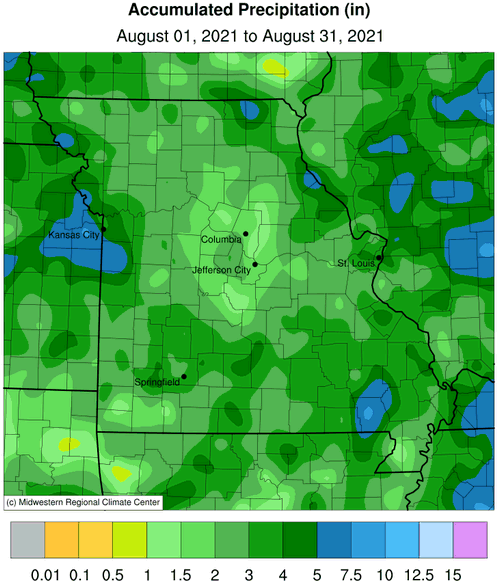
Typical of the summer season, August rainfall was highly variable, ranging from less than 1-inch to over 11-inches, according to rain gauge observations. Most areas received below average rainfall. Radar estimates indicated pockets of more than 5-inches in parts of the state but most locations received less than 3-inches, Figure 10. Some of the lightest and heaviest August rain gauge reports are listed in Table 1. The U.S. Drought Monitor map, for the week of August 31, 2021, indicated small areas of abnormally dry conditions impacting parts of central, southwestern and southeastern Missouri, Figure 11.
| Missouri High and Low Rainfall Extremes for August 2021* | |||
| Station Name* | County | Rainfall (in.) | |
| Heaviest | Poplar Bluff | Butler | 11.29 |
| Wappapello Dam | Wayne | 7.92 | |
| Mound City 7.9N | Holt | 6.98 | |
| Harrisonville 0.4W | Cass | 6.96 | |
| Maryland Heights 1.2ESE | St. Louis | 6.76 | |
| Lightest | Ashland 4.2E | Boone | 0.86 |
| New Bloomfield 5.2W | Callaway | 0.88 | |
| Fayette 6ESE | Howard | 1.11 | |
| Iberia | Miller | 1.24 | |
| Brumley 5.6SW | Camden | 1.30 | |
| *Rain gauges are from the NWS Cooperative Network or CoCoRaHS Observers. | |||
| Table 1. | |||
According to the Missouri Agricultural Statistics Service report for the week ending August 29, 2021, 67% of the state reported topsoil moisture supplies in adequate condition with 2% surplus, whereas 27% of Missouri reported short topsoil moisture supply and 4% very short. Subsoil moisture supplies were reported 74% adequate and 2% in surplus condition compared to 21% of the state reporting subsoil moisture supplies short and 3% very short. Corn was reported 63% in good to excellent condition compared to 77% last year. Soybean was reported 59% in good to excellent condition compared to 75% last year. Pastures were rated at 60% in good to excellent condition compared to 55% last year. Hay and other roughages were 91% adequate to surplus compared to 87% last year. Stock water supplies were 89% adequate and 11% short to very short.
Jump to:
- Figure 1
- Figure 2
- Figure 3
- Figure 4
- Figure 5
- Figure 6
- Figure 7
- Figure 8
- Figure 9
- Figure 10
- Figure 11
- Figure 12
- Figure 13
- Figure 14
- Figure 15
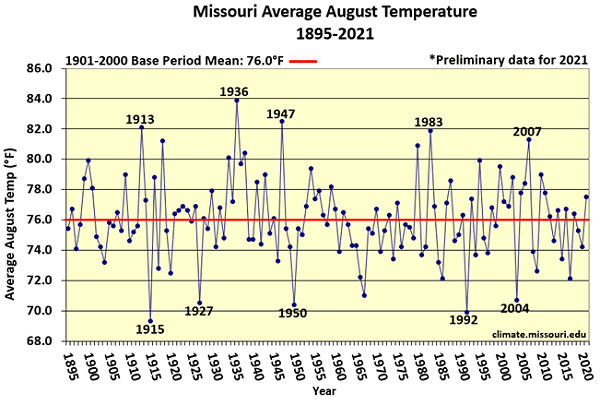
Figure 1.
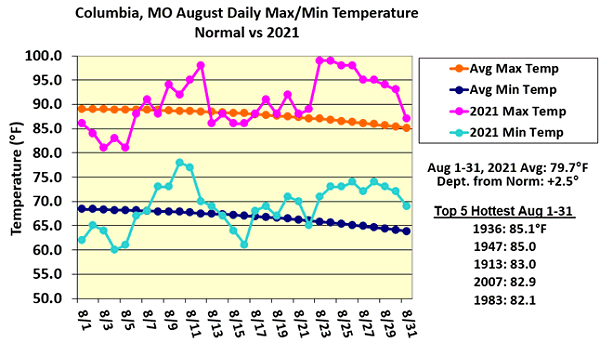
Figure 2.
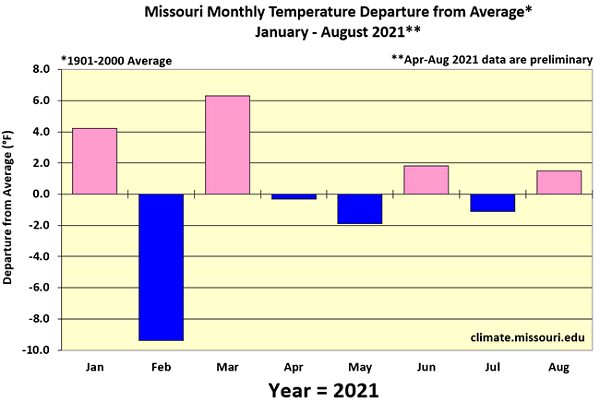
Figure 3.
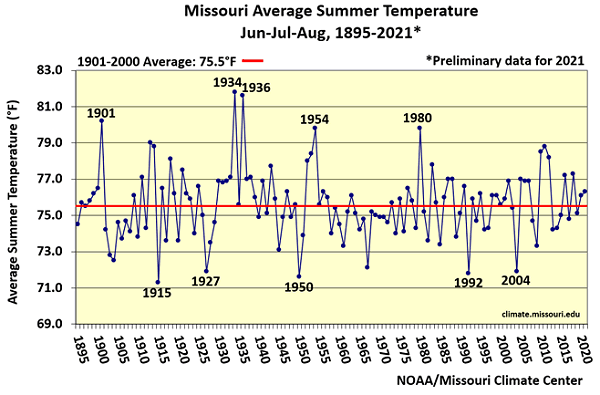
Figure 4.
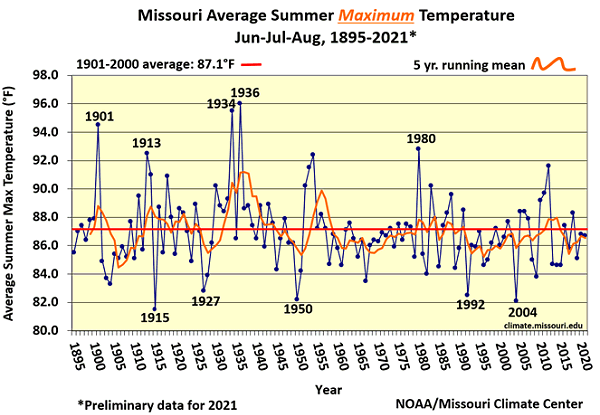
Figure 5.
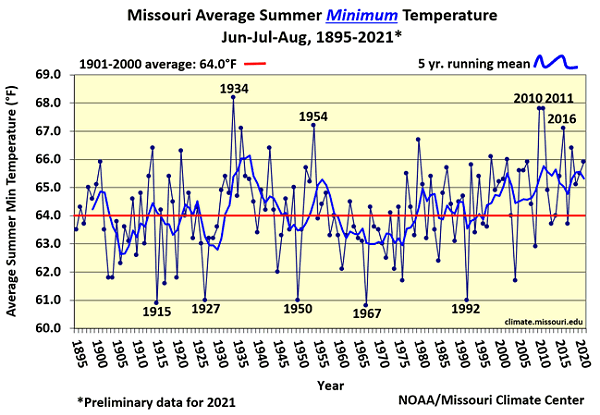
Figure 6.
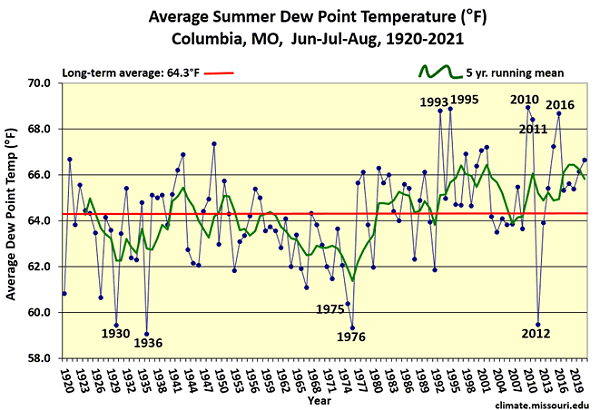
Figure 7.
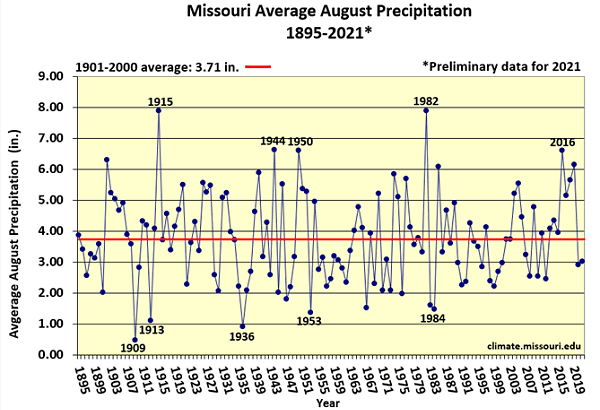
Figure 8.
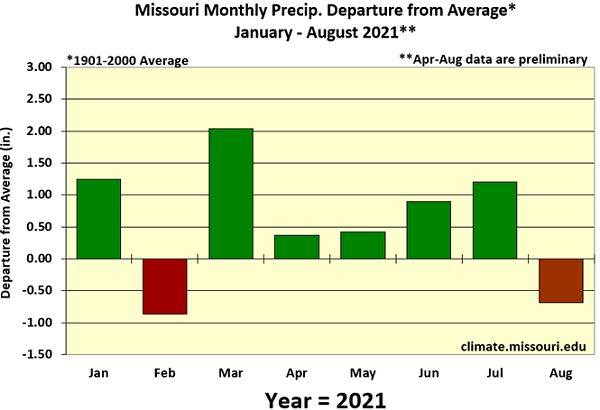
Figure 9.
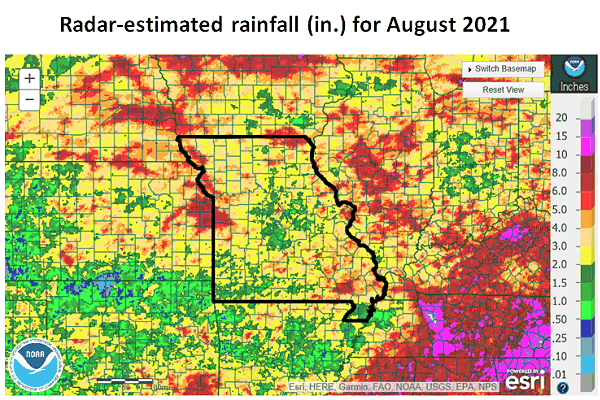
Figure 10.
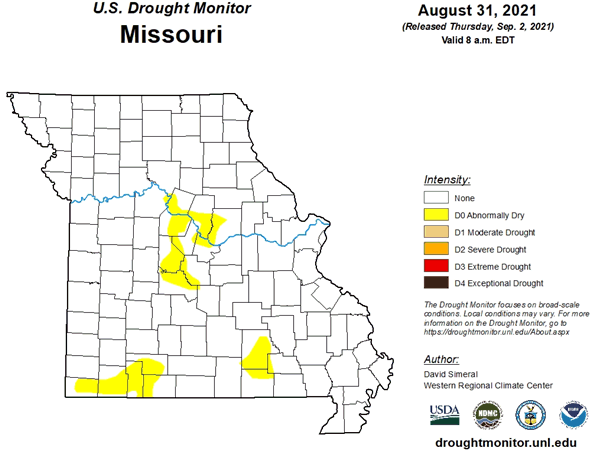
Figure 11.
Source: Pat Guinan, 573-882-5908


