August 2019 Weather and Its Impacts on Missouri
Pat Guinan
State Climatologist
University of Missouri Extension
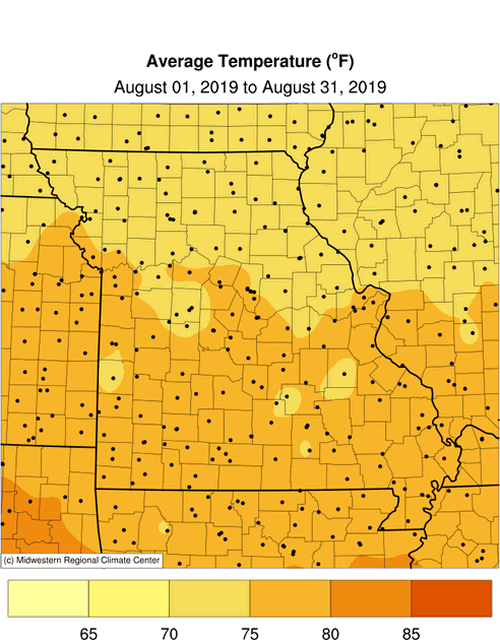
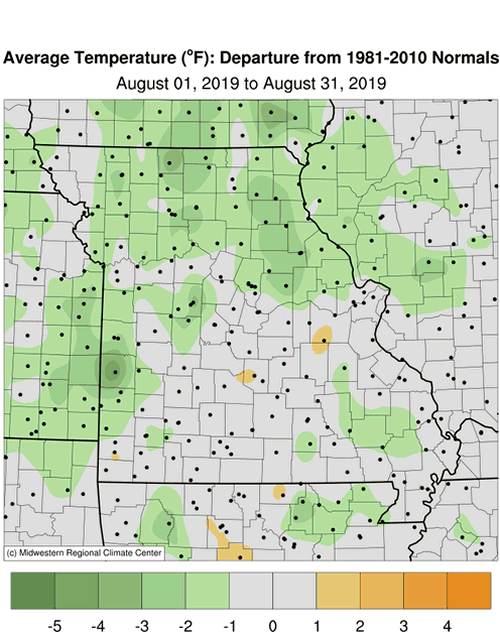
Seasonable August temperatures dominated in Missouri with preliminary data indicating a statewide average temperature of 75.5°F, or 0.6° below the long-term average, Figure 1. Near to above normal temperatures occurred during the first three weeks of August followed by a pleasant 10-day cool spell to wrap-up the month, Figure 2. Summer conditions were generally benign this year with no prolonged periods of extreme high temperatures reported and timely rain events.
Preliminary summer temperature data indicate June and August were slightly below normal with July near normal, Figure 3. The statewide average summer temperature was 75.2°F, 0.4° below the long-term average. Five out of the past seven summers have been cooler than average, Figure 4. Recent historic summer weather patterns indicate little change in maximum temperature trends whereas minimum summer temperatures have been warming, Figures 5 and 6. This phenomenon has been ongoing the past few decades, primarily due to above average summer dew point temperatures in Missouri, Figure 7, which act to suppress maximum air temperature and elevate minimum air temperature.
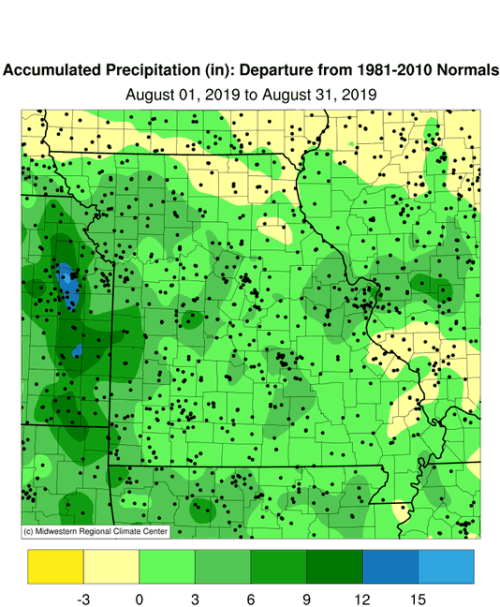
Wet summer conditions persisted into August with timely rains mitigating brief spells of dryness in some areas of the state. Preliminary data indicate a statewide average of 5.98 inches, or 2.28 inches above the long-term average. It was the 8th wettest August on record and wettest August since 2016, Figure 8. The month paralleled unusually wet conditions Missouri has experienced this year, Figure 9. April is the only month, so far, reporting slightly below average precipitation. The year is currently on pace to be the wettest on record, with a statewide year-to-date average total of 40.79 inches, slightly ahead of the previous wettest Jan-Aug on record, which occurred in 2008, Figure 10.
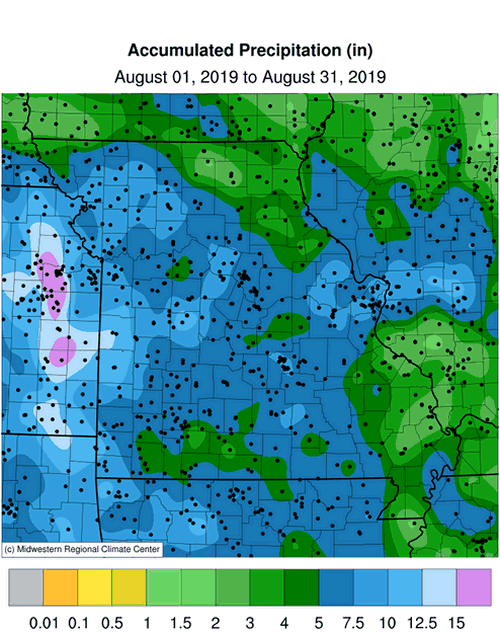
Typical of the summer season, August rainfall was highly variable, ranging from less than two inches to over a foot. However, for the majority of locations rainfall was above average. Heaviest amounts occurred over west central and a few far southwestern and east central counties. Lowest totals were confined to some far northeastern counties and few southeastern border counties. Some of the lightest and heaviest monthly totals are listed in Table 1.
| August 2019 | |||
| Station Name* | County |
Rainfall (in.) | |
| Lightest | Kirksville 1.4S | Adair | 1.83 |
| Ste. Genevieve 1.7SSW | Ste. Genevieve | 1.96 | |
| Clarence Cannon Dam | Ralls | 2.19 | |
| Unionville | Putnam | 2.35 | |
| Cape Girardeau 2.2N | Cape Girardeau | 2.39 | |
| Jackson 1SW | Jackson | 2.45 | |
| Heaviest | Ellington 5.8SE | Reynolds | 13.16 |
| Butler 4W | Bates | 13.14 | |
| Seneca 1N | Newton | 12.99 | |
| Nevada Water Plant | Vernon | 12.67 | |
| Lincoln 0.4NNE | Benton | 12.30 | |
| Manchester 1.4SE | St. Louis | 12.03 | |
| *Rain gauges are from the NWS Cooperative Network or CoCoRaHS Network | |||
| Table 1. | |||
According to the Missouri Agricultural Statistics Service report for the week ending September 1, 2019, 91% of the state reported topsoil moisture supplies in adequate to surplus condition compared to 52% last year. Similarly, 94% of the subsoil moisture supplies were in adequate to surplus condition compared to 34% last year. Corn was reported 38% in good to excellent condition compared to 29% last year. Soybean was reported 46% in good to excellent condition compared to 43% last year. Pastures were rated at 70% in good to excellent condition compared to 15% last year. Hay and other roughages were 84% adequate to surplus compared to 21% last year. Stock water supplies were 98% adequate to surplus compared to 50% last year.
Drought was non-existent in Missouri by the end of August, according to the U.S. Drought Monitor map, Figure 11, and has been all year so far, which is highly unusual. Since January 1, 2000, the only other January through August period that remained drought-free in Missouri was in 2009.
Jump to:
- Figure 1
- Figure 2
- Figure 3
- Figure 4
- Figure 5
- Figure 6
- Figure 7
- Figure 8
- Figure 9
- Figure 10
- Figure 11
- Figure 12
- Figure 13
- Figure 14
- Figure 15
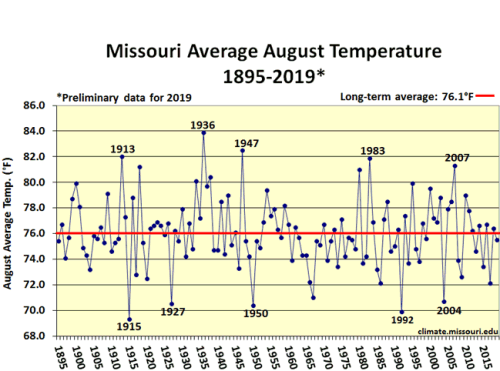
Figure 1.
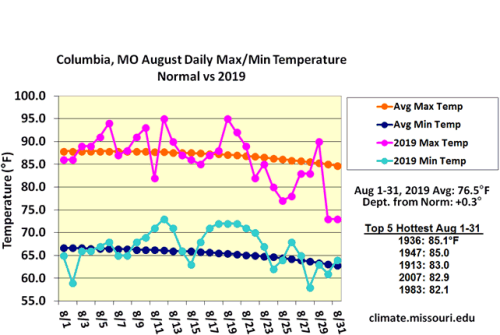
Figure 2.
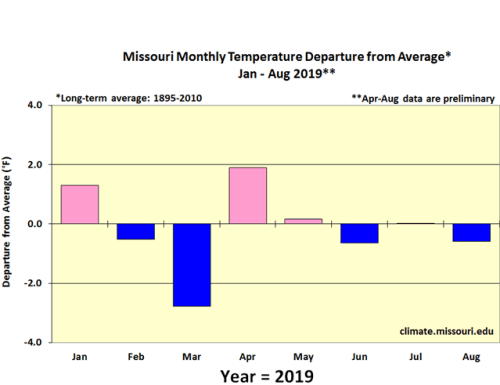
Figure 3.
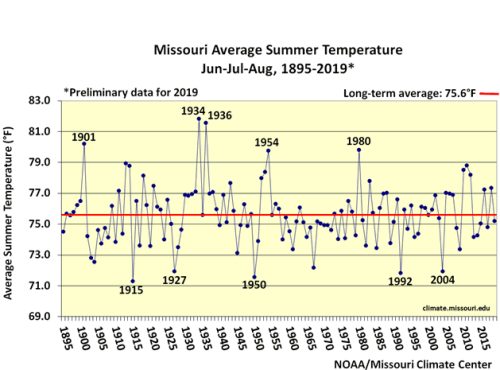
Figure 4.
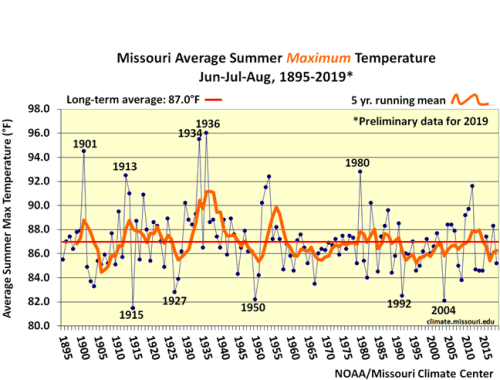
Figure 5.
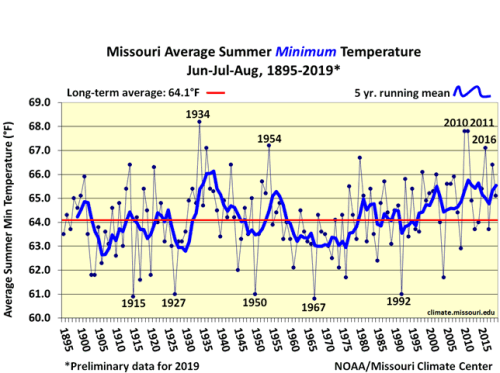
Figure 6.
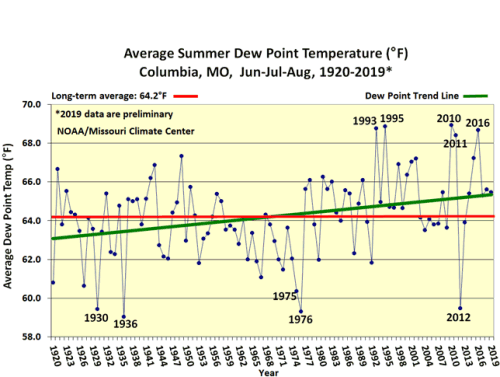
Figure 7.
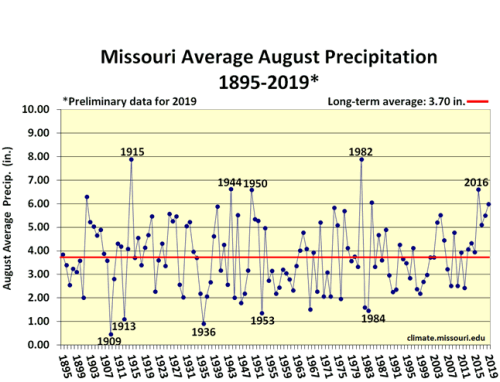
Figure 8.
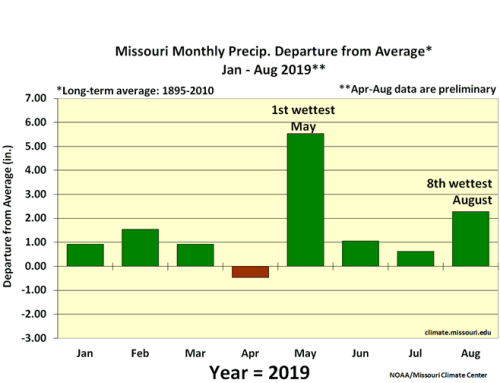
Figure 9.
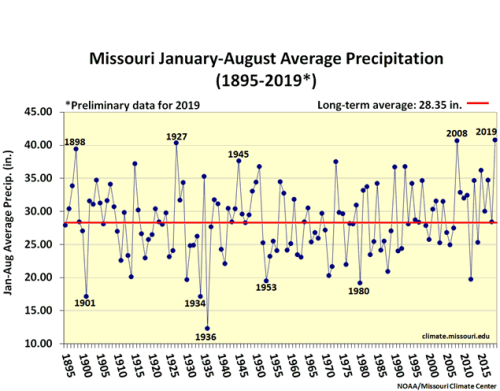
Figure 10.
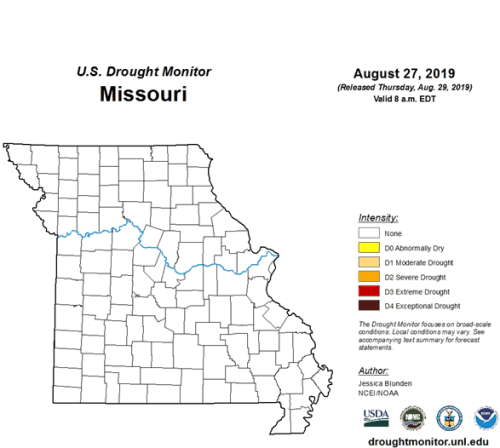
Figure 11.
Source: Pat Guinan, 573-882-5908


