
August 2016 Weather and Its Impacts on Missouri
Pat Guinan
State Climatologist
University of Missouri Extension
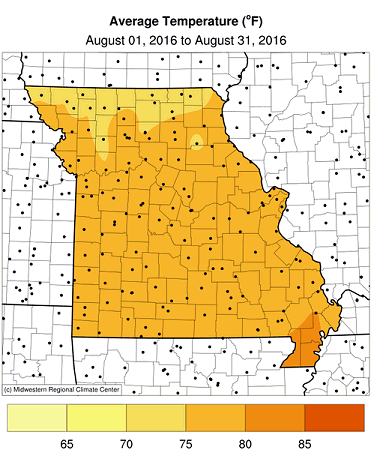
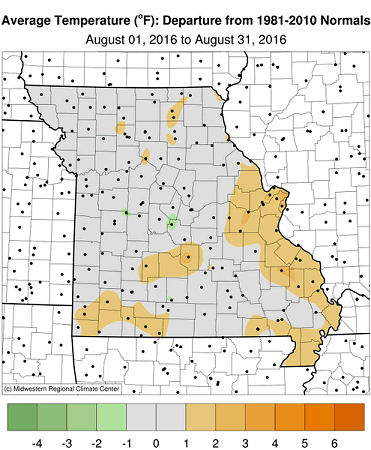
The mild trend over the past several months continued through August for Missouri, Figure 1. Preliminary data indicate the statewide average temperature for August was slightly less than 1°F above normal, Figure 2. The mean temperature, however, did not tell the whole story for August temperatures and was a recurring theme this summer (Jun-Jul-Aug). Daily summer maximum and minimum temperatures for Columbia compared to normal are indicative of what summer was like this year for Missouri, Figure 3. Preliminary data indicate the statewide average summer minimum temperature was 3.1°F above normal, compared to the statewide average summer maximum temperature which was 0.5°F above normal. This phenomenon has been a notable trend over the past few decades, Figures 4 and 5. This year, the average summer minimum temperature of 67.2°F (+3.1) tied with 1954 for the 4th warmest on record.
A contributing factor toward these summer max/min temperature disparities has been unusually high summer dew point temperatures in Missouri, Figure 6. This summer was unusually humid, similar to 2010 and 2011, and resulted in high heat indices and uncomfortable outdoor conditions for people, pets and livestock. Gulf of Mexico air masses over the region, in combination with abundant rainfall, led to efficient evapotranspiration from soil and plants. These conditions utilized a notable amount of the sun's energy, and acted to suppress maximum temperatures, but kept minimum nighttime temperatures elevated.
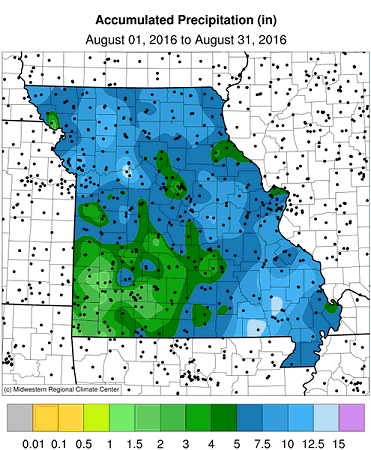
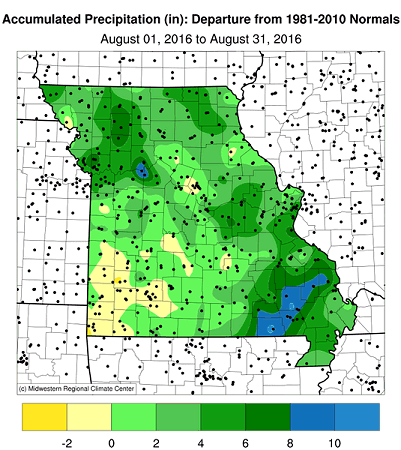
The wet period that began in July persisted into August. Most of the state experienced above normal rainfall, with preliminary data indicating a statewide average of 6.76 inches, or 3.06 inches above the long-term average. It was the 3rd wettest August on record and the wettest August since 1982, Figure 7. The July-August period this year ranked as the 2nd wettest on record (13.35") and wettest July-August period in more than a century (1915), Figure 8.
Even though statewide average rainfall was above normal, there was variability around the state with some areas reporting drier than normal conditions. Figure 9 is a radar image of estimated rainfall for August, and indicates wettest and driest parts of the state. Some counties in southwestern Missouri reported less than 2-inches for the month, whereas 10 or more inches were observed over portions of west central, northern and southeastern Missouri. Tables 1 and 2 provide some of the highest and lowest totals for the month, respectively.
| Highest August 2016 Rainfall* | ||
| Location | County | Total Rainfall (in.) |
| Williamsville | Wayne | 17.58 |
| Waverly 3W | Lafayette | 15.96 |
| Blackburn 3.0NNE | Saline | 15.39 |
| Smithville 3.4E | Clay | 15.11 |
| Doniphan | Ripley | 14.35 |
| Carrollton | Carroll | 14.30 |
| Kansas City 5.1SE | Jackson | 13.62 |
| Jackson 1.0SW | Cape Girardeau | 13.48 |
| Hamilton 2W | Caldwell | 13.02 |
| Poplar Bluff 4.2NW | Butler | 12.96 |
| *Rainfall reports from NWS, CoCoRaHS and Missouri Mesonet | ||
| Table 1. | ||
| Lowest August 2016 Rainfall* | ||
| Location | County | Rainfall (in.) |
| Lockwood | Dade | 1.21 |
| Golden City 0.6SSW | Barton | 1.49 |
| Brookline 2.3NNW | Greene | 1.70 |
| Umber View Heights | Cedar | 1.75 |
| Stark City 5.5ENE | Newton | 1.77 |
| Cassville 4.8SSE | Barry | 1.80 |
| Miller 6.2WNW | Lawrence | 1.81 |
| Anderson 3W | McDonald | 2.10 |
| Urich 2SW | Henry | 2.42 |
| Salem 10W | Dent | 2.64 |
| *Rainfall reports from NWS, CoCoRaHS and Missouri Mesonet | ||
| Table 2. | ||
There were numerous significant rain events impacting the state during the month, with reports of flash flooding leading to flooded roadways, swamped cropland, overflowing rivers and streams, property damage and water rescues. Some of the highest daily totals for the month and the day they occurred are listed in Table 3.
| Location | County | 1-day total (in.) | Date |
| Waverly 3W | Lafayette | 10.11 | Aug 1 |
| Blackburn 3.0NNW | Saline | 8.48 | Aug 1 |
| Williamsville | Wayne | 8.11 | Aug 14 |
| Ellington 5.8SE | Reynolds | 7.50 | Aug 14 |
| Jackson 1.0SW | Cape Girardeau | 7.00 | Aug 14 |
| *Rainfall reports from NWS, CoCoRaHS and Missouri Mesonet | |||
| Table 3. | |||
Numerous downpours dropped 7-11 inches of rain in and around the Kansas City area during the last week of the month and resulted in dozens of water rescues. A flood emergency was issued by the National Weather Service office in Kansas City. Other notable flash flood events were reported around the state on Aug 1-2 and 13-16.
According to the Missouri Agricultural Statistics Service report for the week ending August 29, 2016, 91% of the state reported topsoil moisture supplies in adequate to surplus condition. An unusually large percentage of the subsoil moisture supplies (91%) were also in adequate to surplus condition. Corn condition was reported as 76% in good to excellent condition compared to 51% at the same time last year. Soybean condition was 73% in good to excellent condition compared to 32% last year. Pasture conditions were rated at 67% in good to excellent condition compared to 63% last year. Hay and other roughages were 95% adequate to surplus, similar to last year.
The autumn outlook (Sep-Oct-Nov) issued on August 18, 2016 by the Climate Prediction Center indicates an enhanced likelihood of above normal temperatures over all of Missouri, Figure 10. There are equal chances for above, below and near average precipitation for all of the Show Me State with the exception of the Bootheel where a slightly enhanced likelihood of below normal precipitation is anticipated, Figure 11.
Jump to:
- Figure 1
- Figure 2
- Figure 3
- Figure 4
- Figure 5
- Figure 6
- Figure 7
- Figure 8
- Figure 9
- Figure 10
- Figure 11
- Figure 12
- Figure 13
- Figure 14
- Figure 15
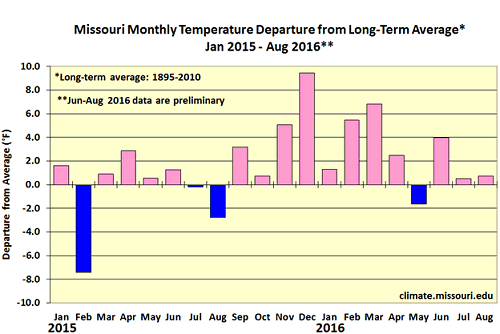
Figure 1.
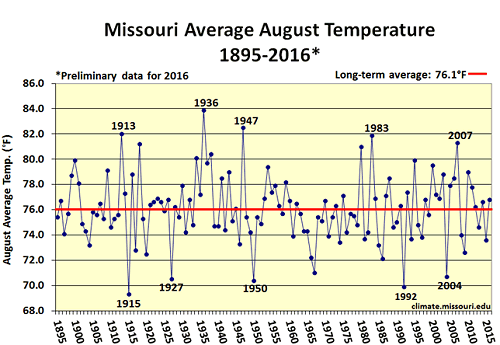
Figure 2.
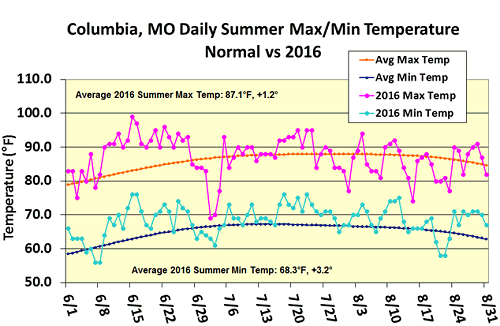
Figure 3.
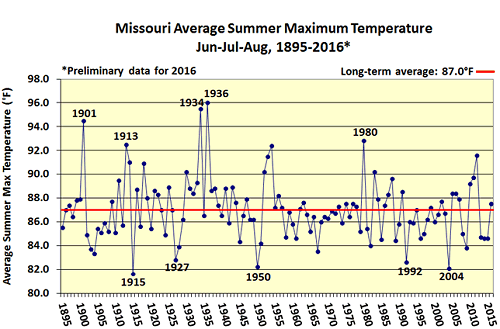
Figure 4.
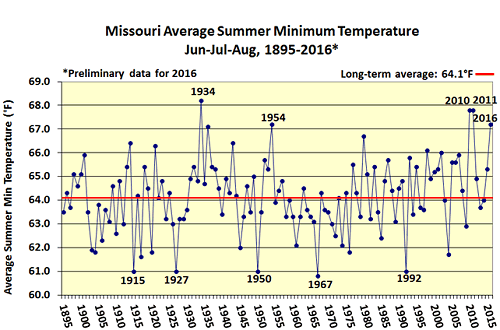
Figure 5.
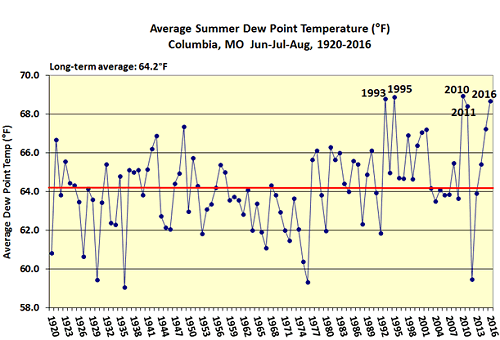
Figure 6.
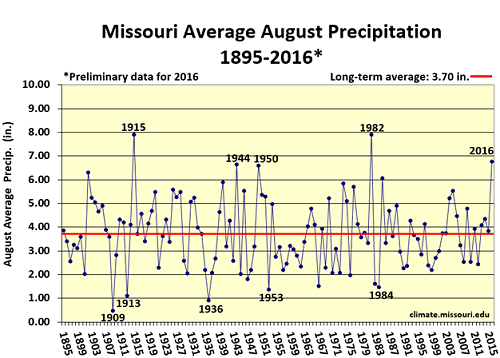
Figure 7.
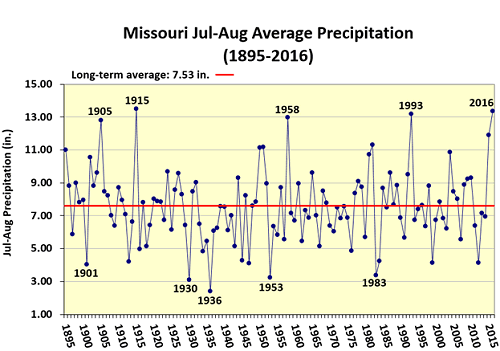
Figure 8.
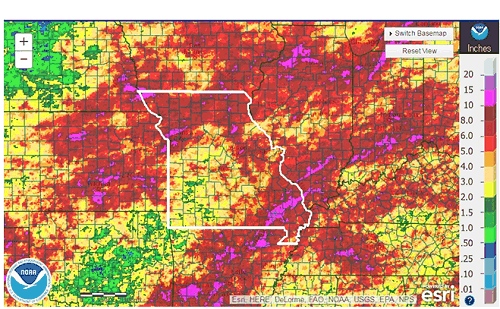
Figure 9. August 2016 Radar Estimated Rainfall (in.)
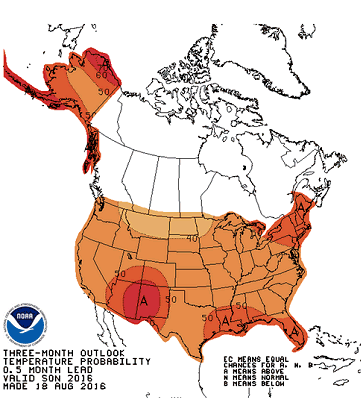
Figure 10. Climate Prediction Center’s Autumn and Temperature Outlook,
Sep-Oct-Nov, 2016
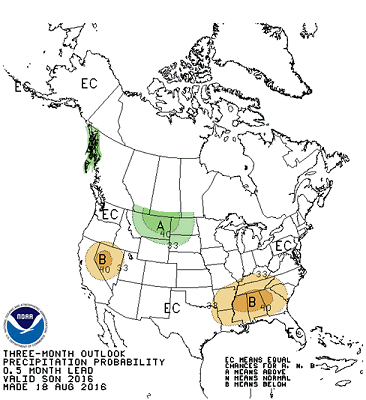
Figure 11. Climate Prediction Center’s Autumn Precipitation Outlook,
Sep-Oct-Nov, 2016
Source: Pat Guinan, 573-882-5908