October 2013 Weather and Its Impacts on Missouri
Pat Guinan
State Climatologist
Commercial Agriculture/University of Missouri Extension
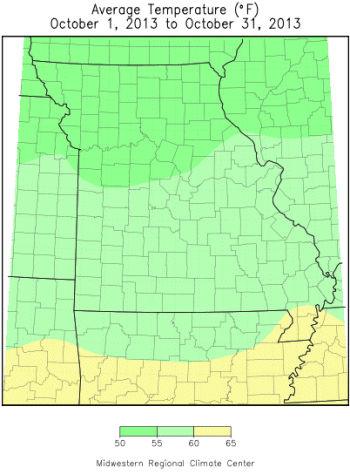
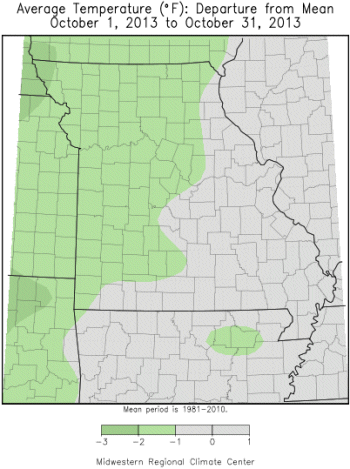
Unseasonably mild temperatures impacted Missouri during the first half of October but a major weather pattern change resulted in much below normal temperatures, freezing temperatures, and record lows during the latter half of the month. Overall, preliminary data indicate an average statewide temperature of 55.7°F, or 1.3° below the long-term normal for October. The monthly average complemented the trend of cool Octobers experienced in Missouri over the past 50 years, Figure 1.
October started mild with high temperatures on most days in the 70's and 80's but a strong cold front barreled through the state on the 14th and 15th and below normal temperatures dominated for the rest of the month, Figure 2. Canadian frontal boundaries brought reinforcing shots of cold air into the region and many locations experienced their first bout of freezing temperatures on the 22nd and 23rd of October. A strong Canadian high pressure system settled over the state on the morning of the 25th and effectively ended the growing season for all of Missouri with sub-freezing temperatures reported statewide. Record low temperatures were reported on October 25 in St. Joseph, Columbia, Rolla and West Plains with 21°, 22°, 24°, 26°F, respectively.
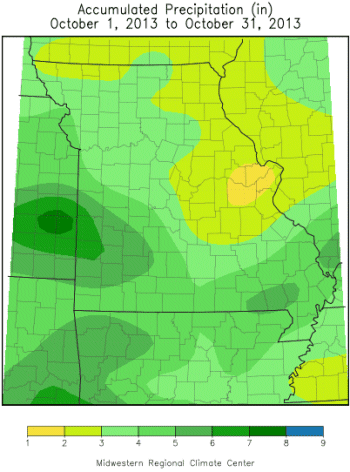
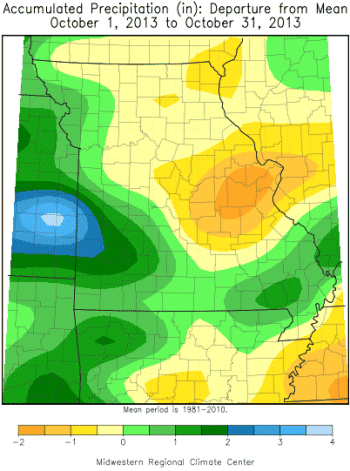
October rainfall was variable across Missouri, averaging mostly above normal over western and southern sections and near to below normal for the rest of the state. Preliminary precipitation data indicate an average statewide total around 3.5 inches, which is near normal.
Heaviest rainfall amounts were reported over southwestern and southeastern sections where 5-6 inches were common. A small part of northwestern and west central Missouri, in and around Andrew and Jackson counties, reported 5-6 inches of rainfall. Nevada (Vernon Co.), Marble Hill (Bollinger Co.), and Springfield (Greene Co.), reported 6.56, 6.68 and 6.93 inches, respectively, for the month.
Lowest monthly totals, generally less than 2-inches, were located across east central sections, west of St. Louis, and in a few locations along the northern tier counties. St. Peters (St. Charles Co.), Valley Park (St. Louis Co.) and Rosebud (Gasconade Co.), reported 1.61, 1.25 and 1.22 inches, respectively, for October.
The biggest rain event to impact the state occurred during the final days of October when a tropical fetch of moisture from the Gulf of Mexico and Pacific Ocean interacted with a strong storm system and frontal boundary over the central U.S. Much of the state received 1-3 inches of rain from October 29-31.
Despite heavy precipitation at the end of the month, moderate to severe drought was still impacting the northern half of Missouri, Figure 3. Large deficits had accumulated since June 1, especially across north central and northeastern sections, and more precipitation was needed to replenish soil profiles and surface water supplies, Figure 4.
As of October 27th, the Missouri Agricultural Statistics Service reported 60% of the pastures across north central Missouri in poor to very poor condition. The northeastern crop reporting district reported 50% of the pastures in poor to very poor condition. Despite these conditions, all crop reporting districts reported the majority of their hay supplies and other roughages as adequate. Stock water supplies remained mostly adequate statewide, though the east central district reported 46% in short supply. As the growing season came to a close, crop conditions across the state were mostly in fair to good condition with winter wheat at 97% and soybean at 57%. The soybean conditions were least favorable across north central (54% poor to very poor) and northeastern (50% poor to very poor) sections.
Jump to:
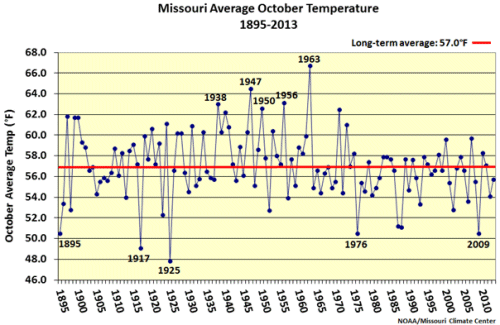
Figure 1
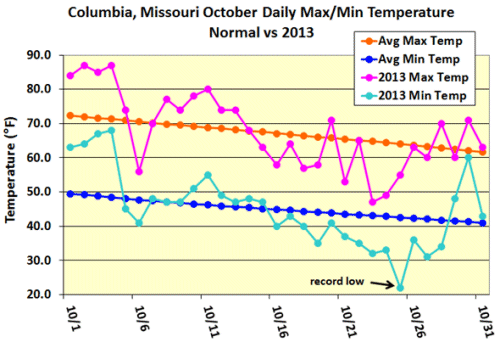
Figure 2
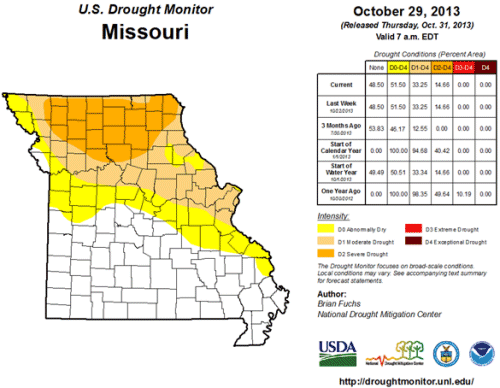
Figure 3
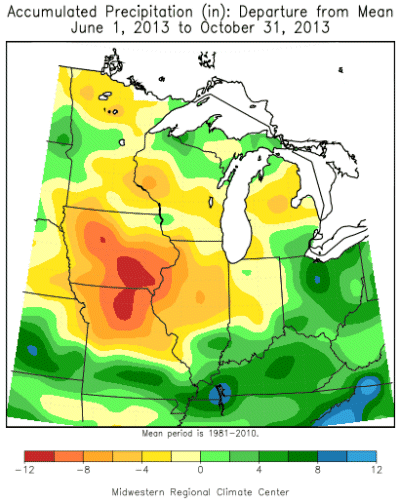
Figure 4
Source: Pat Guinan, 573-882-5908


