June 2024 Weather and Its Impacts on Missouri
Dr. Pat Guinan |
Dr. Zachary Leasor |
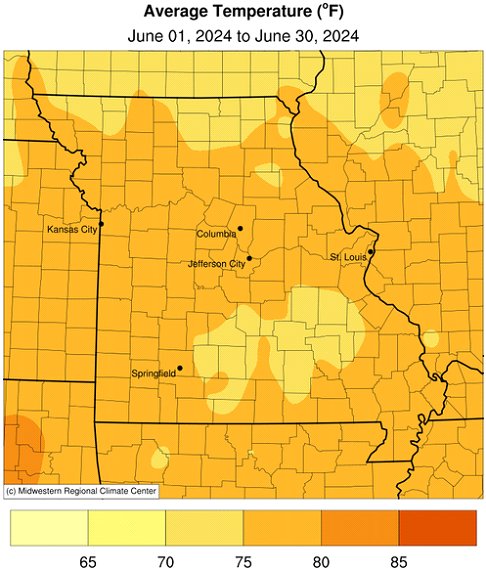
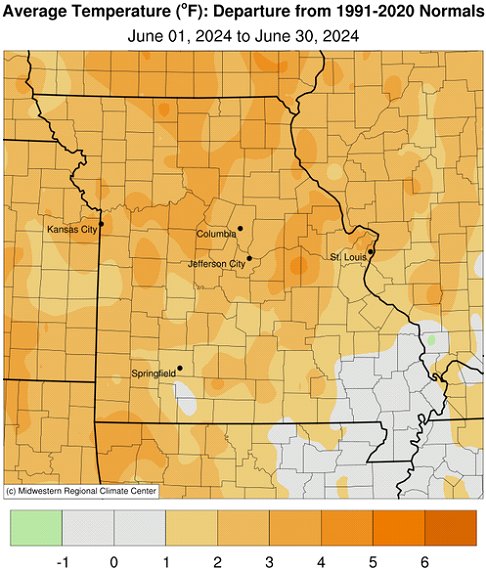
Above average daily maximum and minimum temperatures were prevalent in Missouri during June, Figure 1. Preliminary data indicate a statewide average monthly temperature of 75.8°F, or 2.8 degrees above the baseline average (1901-2000). The warmer than average temperatures followed the trend over the past several years, where only one June over the past two decades has been below average, Figure 2. It was also the fifth warmer than average month for the year, Figure 3.
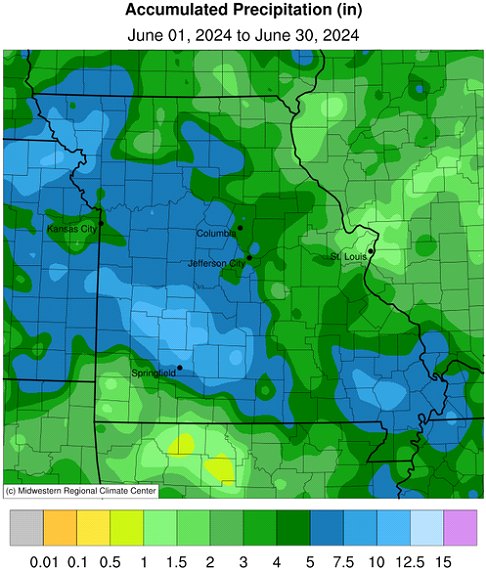
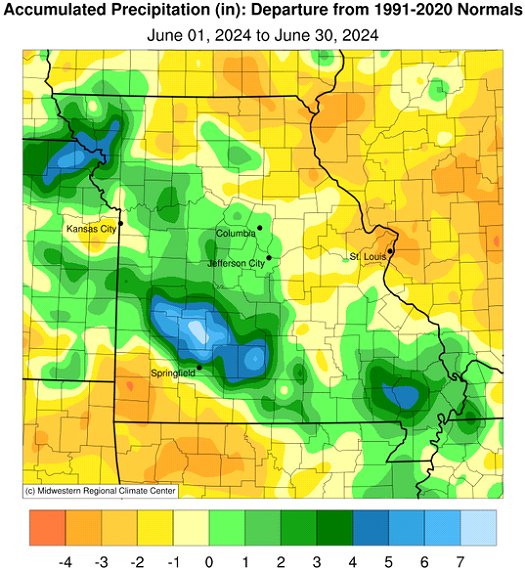
June precipitation was variable across Missouri with areas receiving above, near and below rainfall. The statewide average rainfall total was 4.71 inches, 0.09 inches above the baseline average (1901-2000), Figure 4. It was the fourth month this year with above average precipitation, Figure 5.
Wettest conditions were found across northwestern, west central, southeastern and a portion of southwestern Missouri. Drier weather, with below normal precipitation, was found in north central, northeastern, east central and far southwestern sections. Some of the heaviest and lightest June rain gauge totals are listed in Tables 1 and 2.
| Highest June 2024 Rainfall (in) - NWS Coop and CoCoRaHS reports | ||
| Location | County | June 1-30 |
| Goodson 0.5NNW | Polk | 13.29 |
| Collins 5.5WNW | St. Clair | 12.74 |
| Buffalo 1.0SW | Dallas | 12.69 |
| Fair Grove 4.7SSW | Greene | 12.52 |
| Stockton 0.5W | Cedar | 12.37 |
| Phillipsburg 5.0NW | Laclede | 12.16 |
| St. Joseph 1.3NNW | Buchanan | 11.11 |
| Conception | Nodaway | 10.70 |
| Oregon 1.3ESE | Holt | 10.62 |
| Hermitage 0.5ESE | Hickory | 9.78 |
| Table 1. | ||
| Lowest June 2024 Rainfall (in.) - NWS Coop and CoCoRaHS reports | ||
| Location | County | June 1-30 |
| St. Louis Lambert AP | St. Louis | 1.12 |
| Branson AP | Taney | 1.20 |
| Jamesport 1.3ESE | Daviess | 1.28 |
| Cottleville | St. Charles | 1.37 |
| Anderson 4.2W | McDonald | 1.40 |
| Purdy 4.8SSW | Barry | 1.43 |
| Shoal Creek Estates 0.2SE | Newton | 1.52 |
| Joplin Regional AP | Jasper | 1.53 |
| Memphis 1.1S | Scotland | 1.59 |
| Emerald Beach 5.5E | Stone | 1.75 |
| Table 2. | ||
Some of the drier regions of the state experienced worsening conditions according to the U.S. Drought Monitor, Figure 6. These areas include northeastern Missouri and a small portion of west central, east central and far southwestern Missouri.
According to the Missouri Agricultural Statistics Service, for the week ending June 30, 35% of corn was silking compared to a 5-year average of 10%. Soybean was 91% emerged, compared to a 5-year average of 84%. Topsoil moisture supplies were rated 10% surplus, 79% adequate, 10% short, and 1% very short, while subsoil moisture was rated at 9% surplus, 78% adequate, 13% short and 0% very short. Corn condition was rated 14% excellent, 64% good, 15% fair, 4% poor, and 3% very poor. Soybean was reported at 12% excellent, 64% good, 17% fair, 5% poor and 2% very poor. Pasture conditions were rated 7% excellent, 75% good, 18% fair and 0% poor and very poor. Most of the hay supplies and other roughages were reported adequate at 89%, 5% surplus and 6% short. Stock water supplies were mostly adequate at 80%, 18% surplus and 2% short.
Jump to:
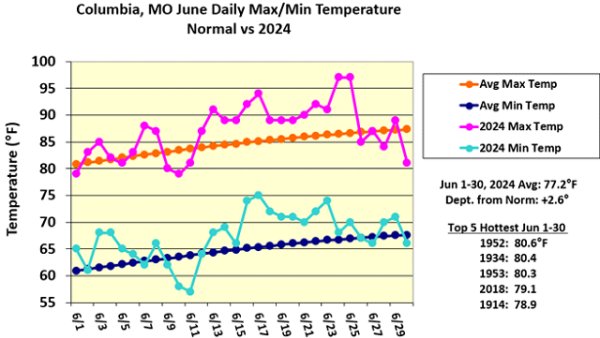
Figure 1.
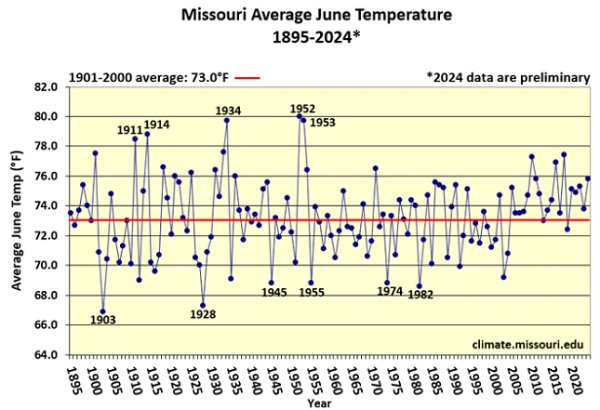
Figure 2.
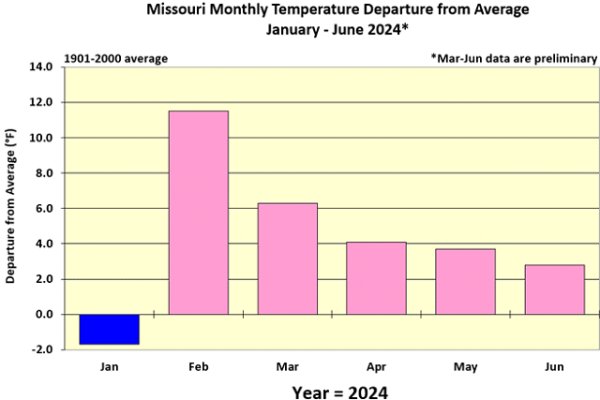
Figure 3.
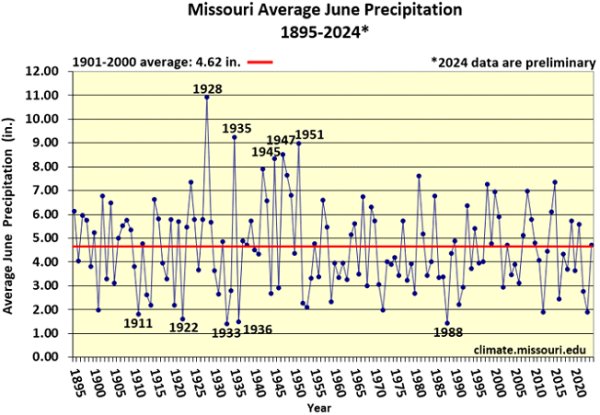
Figure 4.
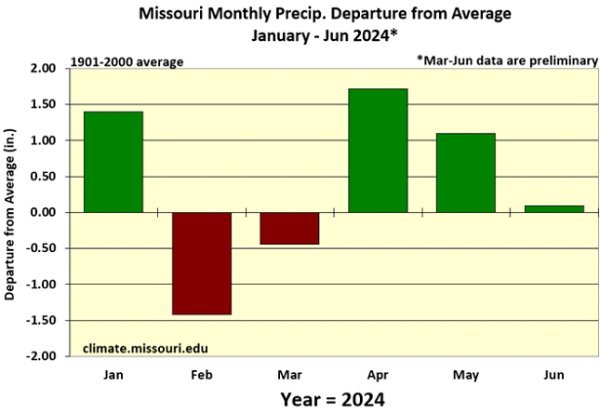
Figure 5.
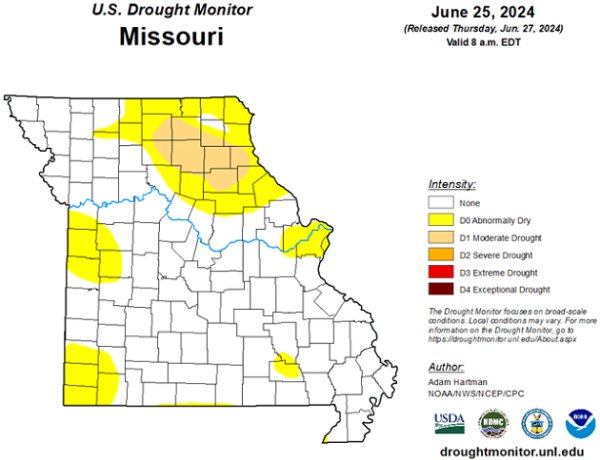
Figure 6.
Source: Dr. Pat Guinan and Dr. Zack Leasor | 573-882-5908


