Beat the Heat; It Can Save Your Life
Pat Guinan
State Climatologist
Commercial Agriculture/University of Missouri Extension
Most of us know the dangers involved with lightning, tornadoes, thunderstorms, and floods but there is one weather phenomenon that is more life threatening to Missourians. Since 1990, heat waves in Missouri have killed more people than all the severe weather elements combined (Table 1.) Heat waves have the reputation of being a silent killer because their evolution is over a period of days or weeks and they don't leave instant paths of devastation associated with tornadoes, straight-line winds and flash floods. Nor do they have the awe inspiring characteristics of lightning.
The summer of 1995 was a wake up call for people to take extreme heat conditions seriously. There were 1,021 heat related fatalities during the summer of 1995 and most of them occurred within a 5 day period in July. A deadly combination of high temperature and humidity in the Midwest created stifling conditions that were unrelenting. In Chicago alone, 525 people perished.
The most vulnerable population in heat waves are the elderly. Additionally, urban locations, laden with concrete, asphalt and traffic, tend to be hotter than surrounding rural communities. Indeed, most of the casualties associated with the '95 heatwave were elderly people living in Chicago. A large number of victims had no air conditioning and were afraid to open their windows for fear of crime. Their homes became virtual ovens. Other factors contributing to the high death toll were little preparation or warning of the impending heat wave, power failures, and inadequate hospital facilities with limited ambulance service.
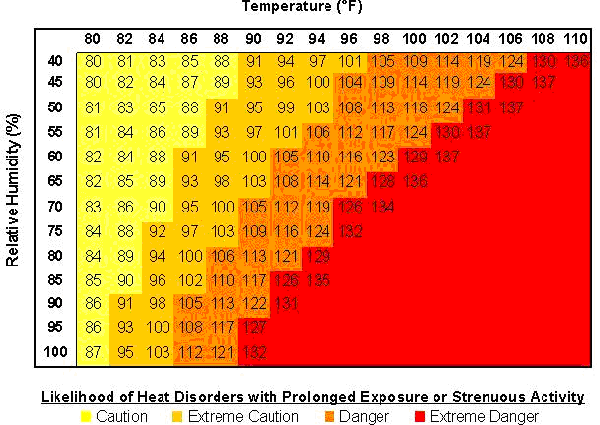
Fortunately, over the past several years, federal, state and local agencies have realized the importance of bringing public awareness to the forefront. The National Weather Service has devised a formula utilizing temperature and relative humidity to create a Heat Index (HI), (also know as the "apparent temperature".) The HI chart will match the current temperature and relative humidity to give you a heat index value (Table 2.) The value will fall within four categories—caution, extreme caution, danger, and extreme danger with each category carrying associated risks. The HI chart applies only to humans but pet and livestock owners should also be aware of heat risks to animals as well. More information concerning heat waves can be found at: http://www.weather.gov/om/heat/index.shtml
Natural Hazard Fatalities in Missouri
| Lightning | Tornado | Thunderstorm Winds | Flood | Heat | Cold | |
| 1990 | 0 | 0 | 0 | 0 | 0 | 0 |
| 1991 | 0 | 2 | 0 | 0 | 0 | 0 |
| 1992 | 0 | 0 | 0 | 0 | 0 | 0 |
| 1993 | 2 | 0 | 0 | 13 | 0 | 0 |
| 1994 | 3 | 2 | 0 | 3 | 4 | 0 |
| 1995 | 1 | 2 | 1 | 3 | 41 | 0 |
| 1996 | 1 | 0 | 4 | 7 | 2 | 0 |
| 1997 | 0 | 0 | 0 | 6 | 3 | 0 |
| 1998 | 0 | 0 | 0 | 13 | 5 | 0 |
| 1999 | 0 | 0 | 0 | 4 | 77 | 0 |
| 2000 | 0 | 0 | 0 | 2 | 17 | 1 |
| 2001 | 0 | 1 | 0 | 3 | 30 | 1 |
| 2002 | 5 | 4 | 0 | 3 | 17 | 0 |
| 2003 | 0 | 19 | 1 | 1 | 12 | 0 |
| 2004 | 0 | 7 | 2 | 1 | 1 | 0 |
| 2005 | 2 | 1 | 0 | 3 | 8 | 0 |
| 2006 | 0 | 13 | 2 | 2 | 16 | 0 |
| 2007 | 2 | 3 | 0 | 2 | 13 | 0 |
| 2008 | 1 | 19 | 0 | 12 | 0 | 0 |
| Total | 17 | 73 | 10 | 78 | 246 | 2 |
TABLE 1. Source: National Climatic Data Center\Storm Data
NOAA’s National Weather Service Heat Index Chart
