
December 2024 Weather and Its Impacts on Missouri
Dr. Pat Guinan |
Dr. Zachary Leasor |
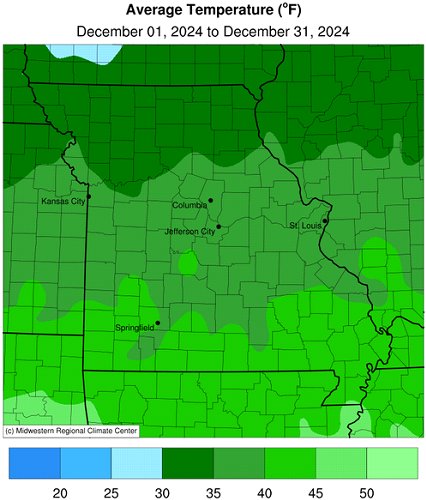
A west-northwesterly upper air flow pattern was dominant over the north central U.S. in December and translated to roller-coaster temperature variations for the Show Me State, Figure 1. Seasonably mild winter days were the rule with a few brief cold air incursions from the northwest. Preliminary data indicate the average statewide December temperature for Missouri was 38.0°F, or 5.0° above the long-term average. It was the 8th consecutive above-average December, Figure 2.
The above average December was representative of the year with nine months experiencing warmer than normal temperatures in 2024, Figure 3. Preliminary data indicate 2024 was the second warmest year on record, eclipsed only by 2012, Figure 4. The statewide temperature average for 2024 was 58.0°F, or 3.5° above the long-term average. It was the tenth consecutive warmer than average year and 22 out of the past 27 years have been above average. Four out of past five warmest years on record in Missouri have occurred since 2012.
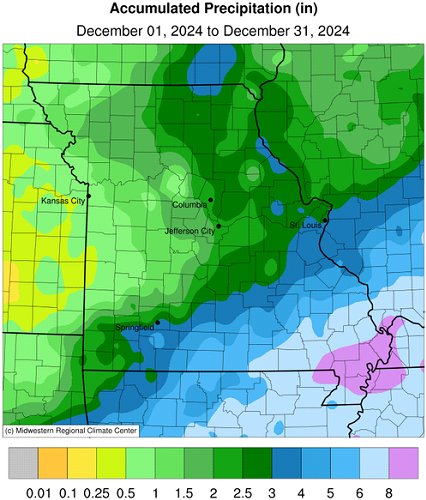
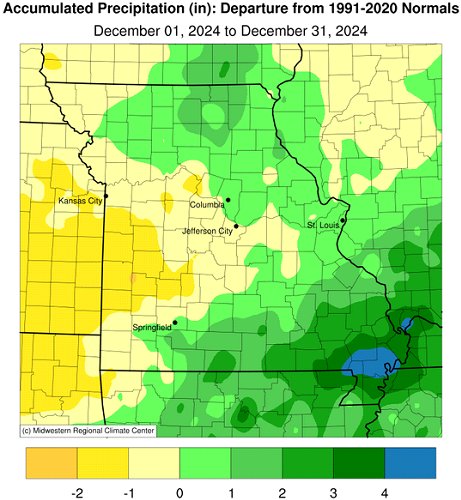
Statewide average December precipitation was 2.69 inches, or 0.38 inches above the long-term average. Four out of the past ten Decembers have been wetter than average, Figure 5. It was the seventh wetter than average month for the year, Figure 6.
According to radar estimates, Figure 7, heaviest December totals occurred over far south central and southeastern Missouri, where greater than 4 inches were common. Parts of the Bootheel received more than 8 inches. Less than 1 inch impacted some far western sections. Lightest and heaviest December rain gauge totals are listed in Table 1.
| Missouri December 2024 Precipitation | |||
| Station Name* | County | Precipitation (in.) | |
| Lightest | Maryville 2E | Nodaway | 0.42 |
| Butler 4W | Bates | 0.43 | |
| Lamar 7.3N | Barton | 0.46 | |
| Belton 1.2S | Cass | 0.53 | |
| Nevada Water Plant | Vernon | 0.53 | |
| Heaviest | New Madrid 0.4ESE | New Madrid | 9.15 |
| Malden Municipal AP | Dunklin | 8.66 | |
| Caruthersville | Pemiscot | 8.56 | |
| Dexter | Stoddard | 8.51 | |
| Sikeston 1.7ENE | Scott | 8.34 | |
| *Rain gauges are from the NWS Cooperative Network and CoCoRaHS | |||
| Table 1. | |||
Total preliminary statewide average precipitation for 2024 was 43.98 inches, 3.48 inches above the long-term average, Figure 8. Eleven out of the past sixteen years have been wetter than average.
According to annual radar estimates for 2024, greater than 50 inches fell over much of east central, south central and far southeastern Missouri, Figure 9. Parts of Wright and Texas Counties, in south central Missouri, reported more than 70 inches. Lightest amounts occurred over parts of northern, west central and far southwestern Missouri with annual radar estimates of less than 40 inches. Some of the lightest and heaviest annual rain gauge reports are listed in Table 2.
| Missouri January thru December Precipitation for 2024 | |||
| Station Name* | County | Precipitation (in.) | |
| Lightest | Steffenville | Lewis | 32.69 |
| Hannibal 9.1WNW | Marion | 32.88 | |
| Clarence Cannon Dam | Ralls | 33.57 | |
| Kansas City International AP | Platte | 34.63 | |
| Trenton 1.2N | Grundy | 34.77 | |
| Heaviest | Hartville 0.5SSE | Wright | 76.15 |
| Summersville 3.6S | Texas | 74.63 | |
| Mountain Grove 2N | Wright | 70.96 | |
| Poplar Bluff 3.7WNW | Butler | 65.58 | |
| Salem 3.5E | Dent | 65.56 | |
| *Rain gauges are from the NWS Cooperative Network and CoCoRaHS | |||
| Table 2. | |||
As of December 31, 2024, the U.S. Drought Monitor indicated abnormally dry to moderate drought affecting portions of western and northeastern Missouri, Figure 10. It was an improvement from the previous month.
The mild December weather translated to lower than usual energy consumption and less stressful conditions for outdoor workers, exposed livestock and pets. Soil moisture content improved with precipitation events. These wetter soil profile conditions will likely remain for the next couple months, and possibly improve, considering cold season temperatures, short day length, dormant vegetation, minimal evaporation rates and additional precipitation.
Jump to:
- Figure 1
- Figure 2
- Figure 3
- Figure 4
- Figure 5
- Figure 6
- Figure 7
- Figure 8
- Figure 9
- Figure 10
- Figure 11
- Figure 12
- Figure 13
- Figure 14
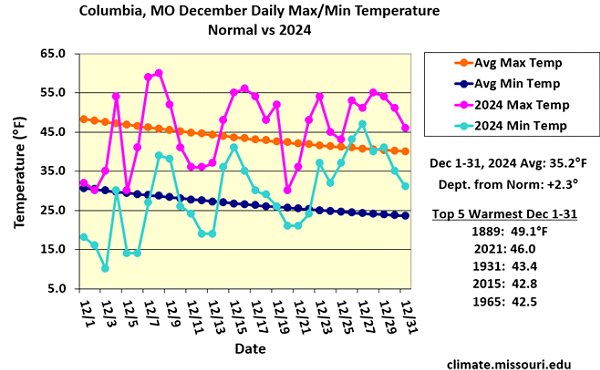
Figure 1.
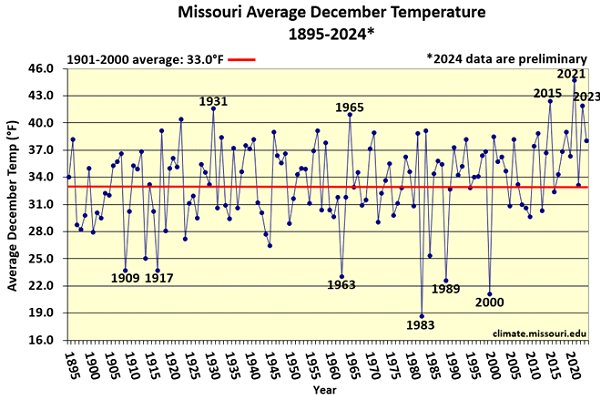
Figure 2.

Figure 3.
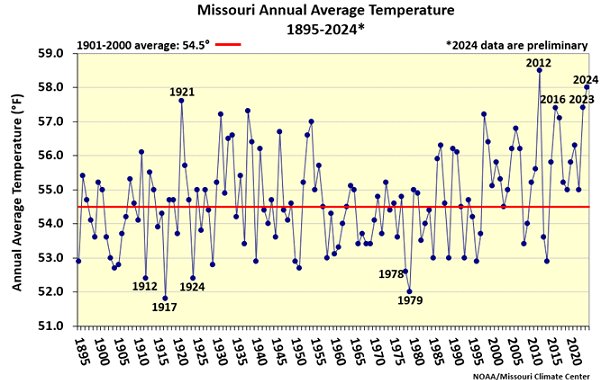
Figure 4.
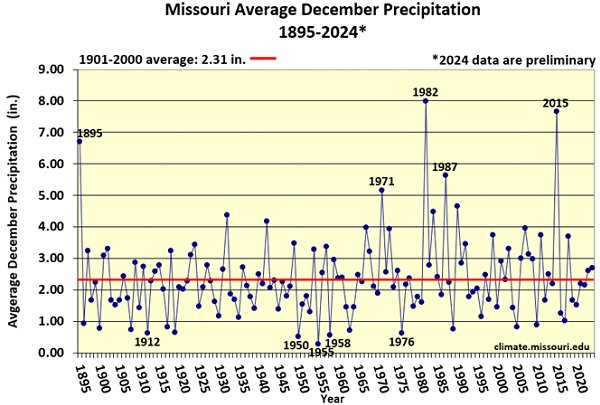
Figure 5.
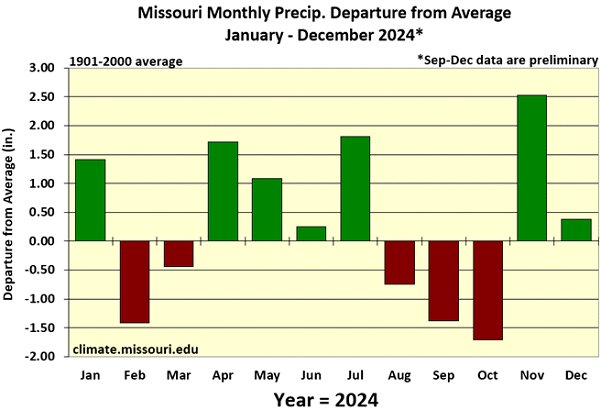
Figure 6.
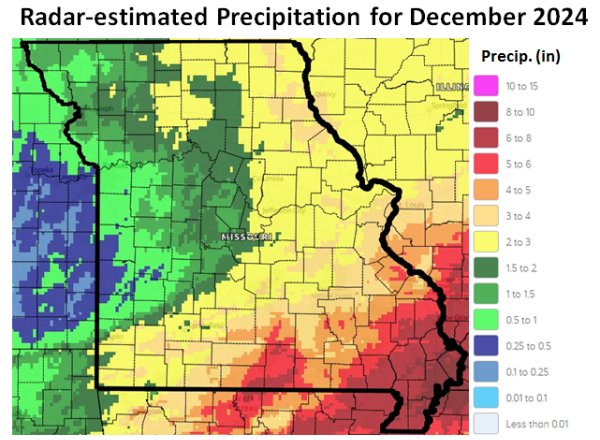
Figure 7.
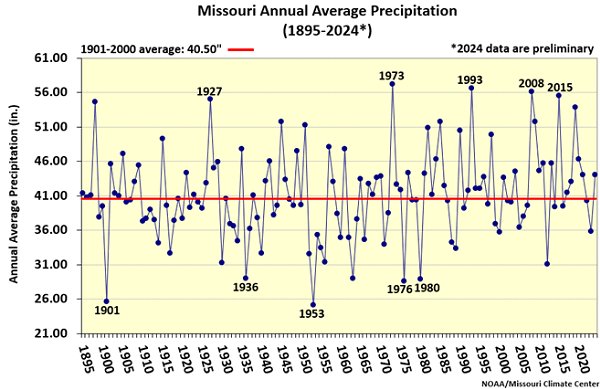
Figure 8.
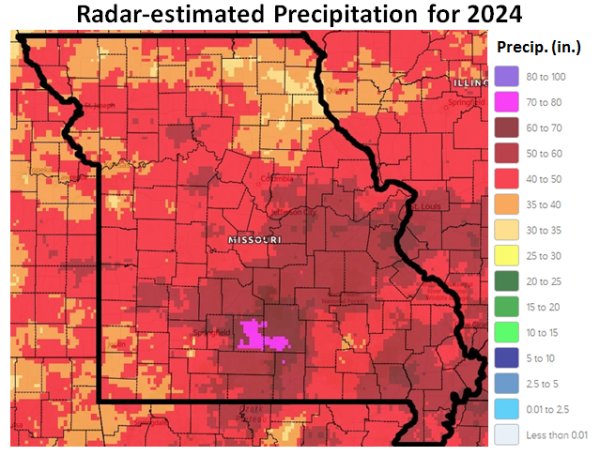
Figure 9.
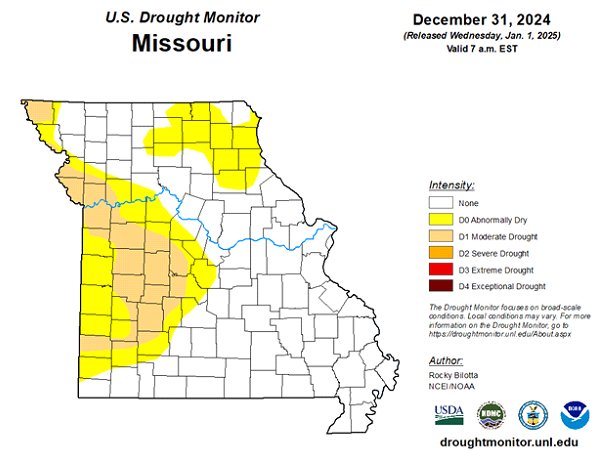
Figure 10.

Source: Dr. Pat Guinan and Dr. Zack Leasor | 573-882-5908