
January 2025 Weather and Its Impacts on Missouri
Dr. Pat Guinan |
Dr. Zachary Leasor |
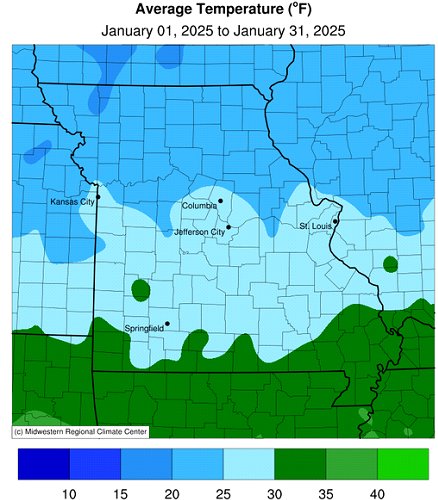
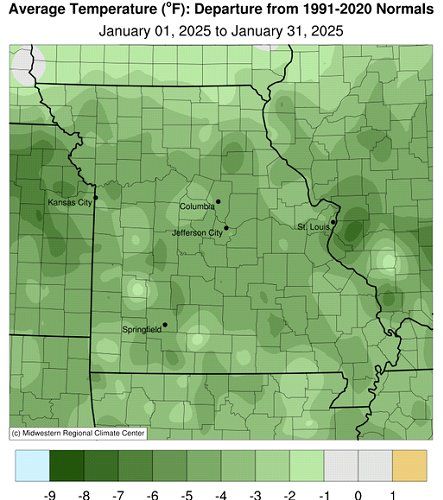
Daily below average temperatures were frequent in Missouri during January, Figure 1, with preliminary data indicating an average statewide monthly temperature of 26.9°F, or 2.5° below the long-term normal. It was the coldest January in over a decade, since 2014, Figure 2, and the first below average month since last summer, Figure 3.
An upper air pattern from the northwest dominated for much of January, bringing Canadian air masses into the region. A lobe of the polar vortex impacted the eastern 2/3 of the country during the third week of January and sub-zero temperatures were felt across much of the Show-Me State. Northern portions of Missouri experienced temperatures double-digits below zero, Table 1.
| January 2025 Extreme Minimum Daily Temperatures in Missouri | |||
| Location* | County | Min Temp (°F) | Date |
| Albany | Gentry | -18 | 22 |
| Smithville Lake | Clay | -17 | 21 |
| Conception | Nodaway | -16 | 21 |
| Unionville | Putnam | -13 | 21 |
| Marshall | Saline | -12 | 22 |
| Maryville 2E | Nodaway | -12 | 22 |
| Marshall | Saline | -12 | 22 |
| Princeton | Mercer | -12 | 21 |
| Cameron | DeKalb | -11 | 22 |
| Cosby 2W | Andrew | -11 | 21 |
| Spickard 7W | Grundy | -11 | 22 |
| Kirksville Regional AP | Adair | -11 | 21 |
| Novelty 1E | Knox | -11 | 21 |
| *NWS Cooperative network and Missouri Mesonet | |||
| Table 1. | |||
The cold January conditions contrasted notably with the previous mild December and translated to higher energy consumption and more days with bitter cold and wind chill for outdoor workers, exposed livestock and pets.
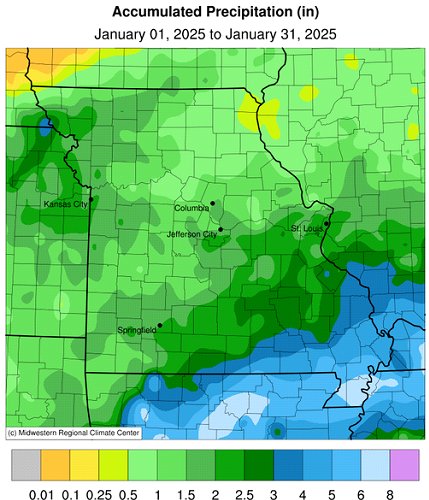
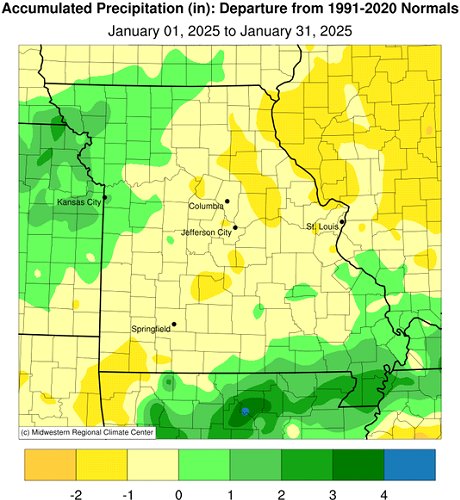
Preliminary January precipitation data indicated a statewide average of 1.94 inches, 0.15 inches below the long-term average, Figure 4. It was the first drier than average month since October, Figure 5. Most of the state reported below average precipitation except for northwestern sections and far southeastern Missouri. The Bootheel received the highest precipitation amounts, typical for this time of year. Parts of northeastern Missouri received less than 0.50 inches for the month. Lightest and heaviest rain gauge reports are listed in Table 2.
| Missouri Rain Gauge Reports for January 1-31, 2025 | |||
| Station Name* | County | Precipitation (in.) | |
| Lightest | Canton Lock and Dam 20 | Lewis | 0.34 |
| Monticello 0.4SSW | Lewis | 0.37 | |
| Kahoka 1.3ESE | Clark | 0.47 | |
| Callao 7.3N | Macon | 0.48 | |
| Shelbyville 5.5NNW | Shelby | 0.50 | |
| Blackburn 3.7E | Saline | 0.52 | |
| Memphis | Scotland | 0.54 | |
| Heaviest | Caruthersville 1.6N | Pemiscot | 7.15 |
| Portageville Delta Center | Pemiscot | 6.40 | |
| Steele 6W | Pemiscot | 6.24 | |
| Senath | Dunklin | 6.13 | |
| Cardwell | Dunklin | 5.92 | |
| Jackson 1.8NNE | Cape Girardeau | 5.63 | |
| *Rain gauges are from the NWS Cooperative Network, CoCoRaHS, and Missouri Mesonet | |||
| Table 2. | |||
Even though precipitation was below average, January snowfall was above average, except for the northern border counties. There were two significant winter storm events during the month, with the first one impacting much of the state on January 5-6, and in the form of snow, sleet and freezing rain. Heaviest snow amounts generally fell along and north of I-70 and ranged from 5-10 inches, with isolated accumulations over a foot, Figure 6. Freezing rain over portions of west central and southern Missouri resulted in several reports of tree and power line damage, power outages and road closures. Heaviest ice loads, between 0.50-0.75" thick, were reported in some locations. The second event occurred on Jan 10-11 and was mostly in the form of snow impacting the southern half of Missouri. Heaviest amounts occurred across southern Missouri where 4-7 inches were common, Figure 7.
According to the U.S. Drought Monitor, stubborn pockets of moderate drought were still impacting parts of northwestern, west central and southwestern Missouri by the end of January, Figure 8.
Jump to:
- Figure 1
- Figure 2
- Figure 3
- Figure 4
- Figure 5
- Figure 6
- Figure 7
- Figure 8
- Figure 9
- Figure 10
- Figure 11
- Figure 12
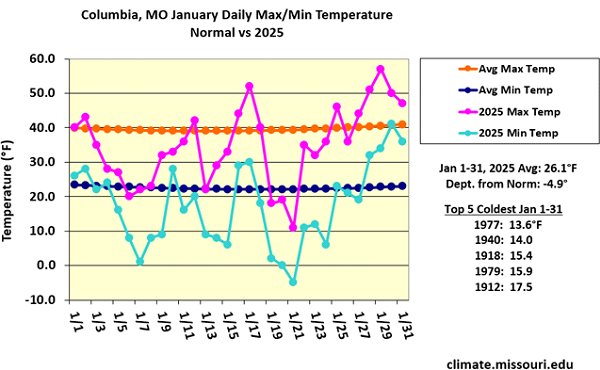
Figure 1.

Figure 2.
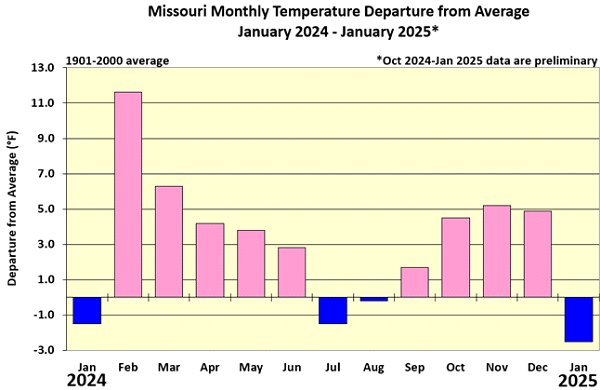
Figure 3.
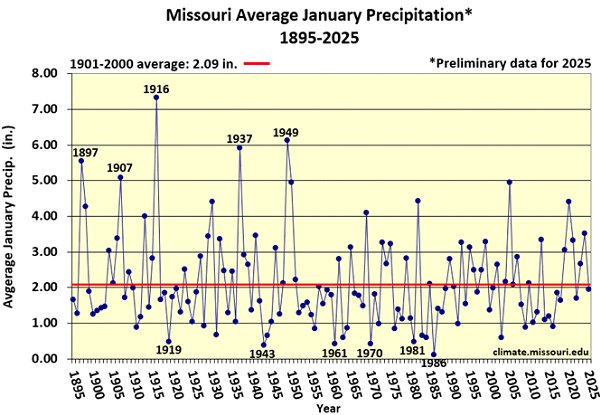
Figure 4.
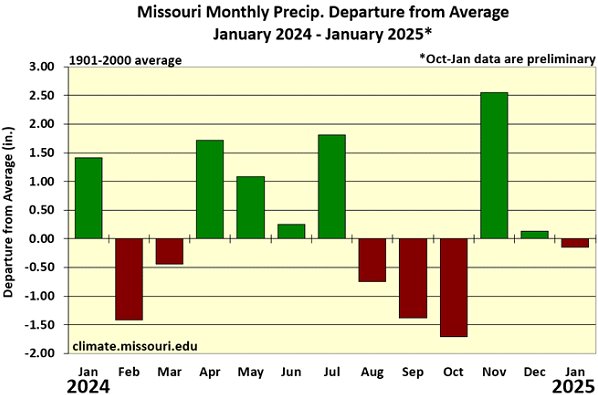
Figure 5.
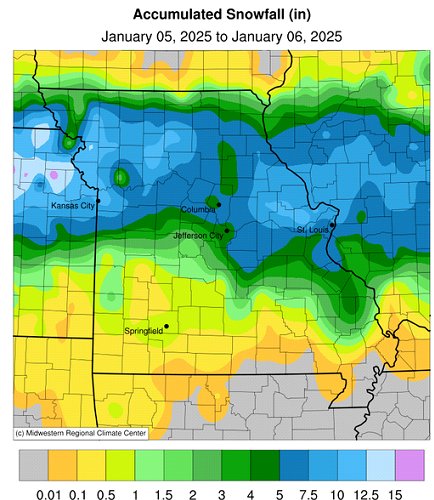
Figure 6.
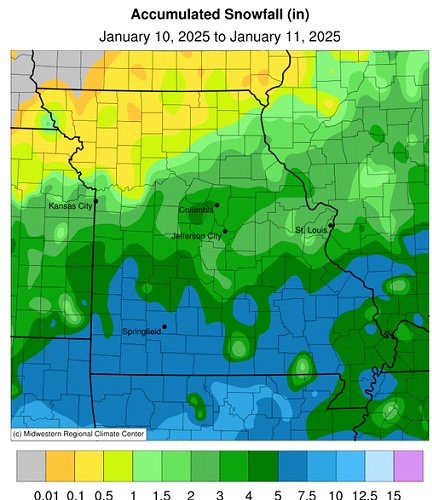
Figure 7.

Figure 8.
Source: Dr. Pat Guinan and Dr. Zack Leasor | 573-882-5908