
January 2015 Weather and Its Impacts on Missouri
Pat Guinan
State Climatologist
Commercial Agriculture/University of Missouri Extension
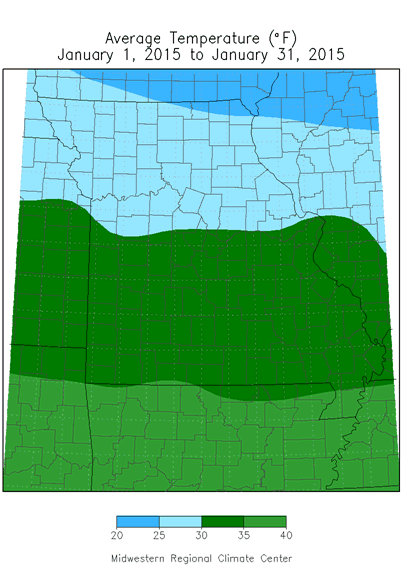
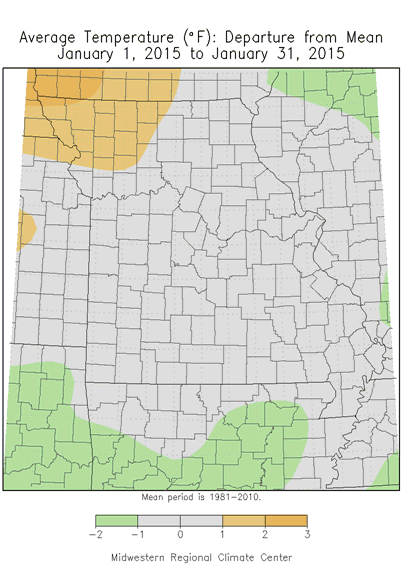
Two very different air masses impacted Missouri during January with modified arctic air encompassing the region for the first half of the month and mild Pacific air dominating during the latter half. Accordingly, temperatures from January 1-14 averaged 7-11 degrees below normal, Figure 1, and 4-11 degrees above normal from January 15-31, Figure 2. Preliminary data for the month indicate a statewide average monthly temperature of 31 degrees F, or 1.4 degrees above the long-term average. The warmer than normal month follows the January trend over the past few decades, Figure 3. Three of the top five warmest Januaries on record have occurred since 1989. It was the first time since last spring when two consecutive months averaged above normal, Figure 4.
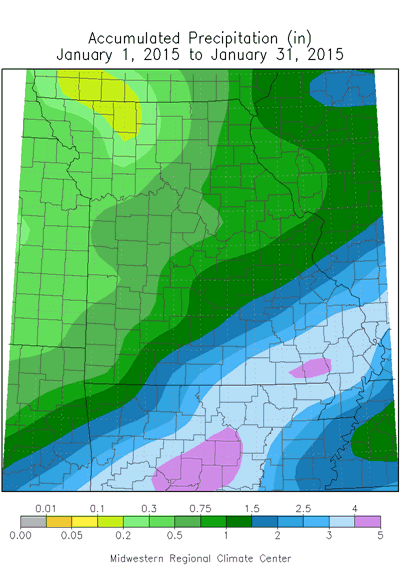
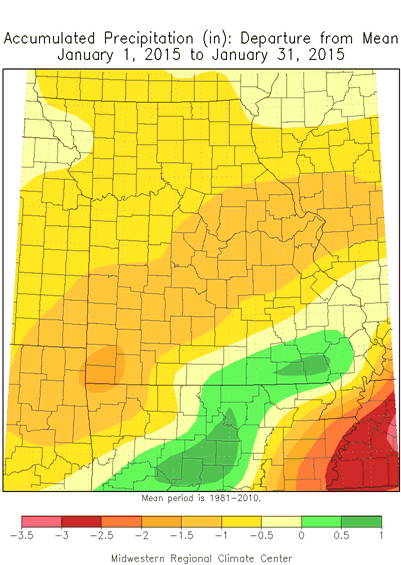
Precipitation was below normal across the state, with the exception of a handful of counties in southeastern Missouri. Preliminary data indicate an average statewide total of 1.2 inches, or nearly an inch below the long-term average. Amounts increased from northwest to southeast and ranged from less than 0.10 inches over parts of northwestern Missouri to more than 4 inches in a few southeastern counties. Lightest totals were observed in DeKalb, Harrison and Gentry counties where 0.09", 0.08, and 0.04" were reported, respectively. Four to five inches of rain fell over parts of Cape Girardeau, Scott, Stoddard, Wayne, Butler and Ripley counties. The drier than normal month follows the trend of dry Januaries over the past few decades, Figure 5.
Snow events were minimal and light during the month with the most significant snowfall occurring on January 3-4 when 1-2 inches fell northwest of a line from Kansas City to Hannibal. Little to no snow fell over the southern 2/3 of Missouri during January, Figure 6. The meager snowfall totals translated to significant savings for communities and transportation officials with budgets for plowing and treatment of roads and sidewalks.
An unusually strong arctic high pressure system impacted the central U.S. during the first week of January with record or near record pressures experienced, Figure 7. Table 1 shows pressure extremes for four locations in Missouri compared to extremes experienced on January 7, 2015.
| Missouri Maximum Sea Level Barometric Pressure | ||||
| Period | Max SLP (in.) | Date | Jan 7, 2015 Max SLP (in.) | |
| Columbia | 1890-2014 | 31.09 | Jan 5, 1924 | 30.98 |
| Kansas City | 1889-2014 | 31.11 | Jan 5, 1924 | 31.08 |
| St. Louis | 1871-2014 | 31.01 | Dec 20, 1924 | 30.98 |
| Springfield | 1888-2014 | 31.03 | Jan 5, 1924 | 30.96 |
| Table 1. Source: NOAA | ||||
Jump to:
- Figure 1
- Figure 2
- Figure 3
- Figure 4
- Figure 5
- Figure 6
- Figure 7
- Figure 8
- Figure 9
- Figure 10
- Figure 11
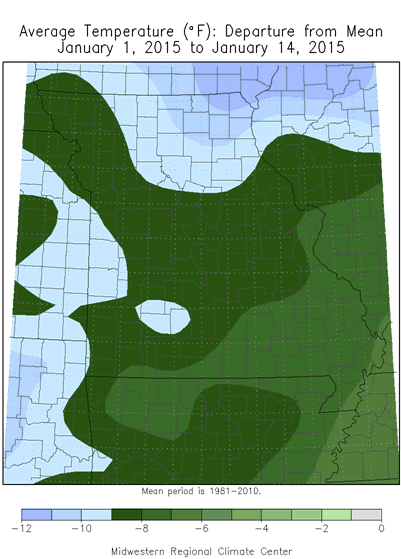
Figure 1.
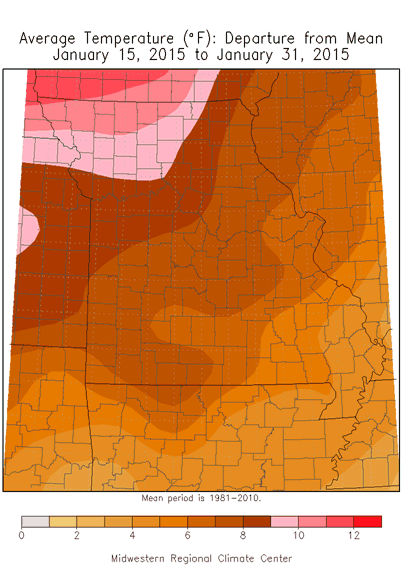
Figure 2.
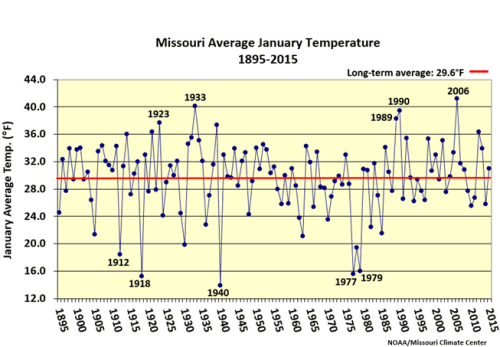
Figure 3.
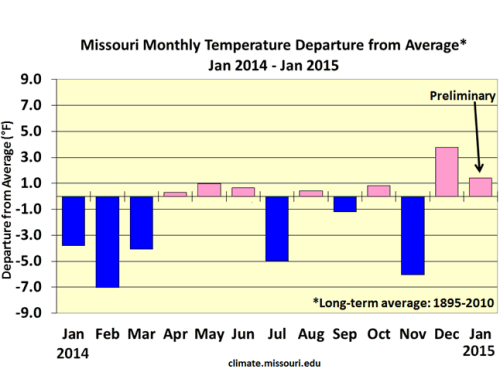
Figure 4.
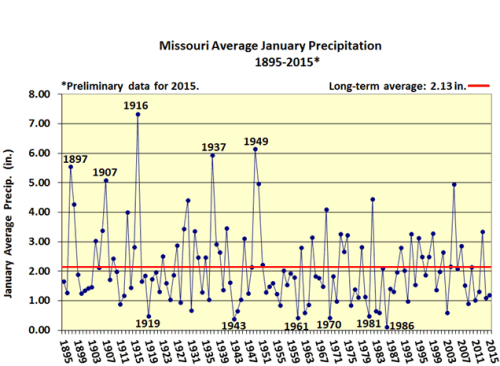
Figure 5.
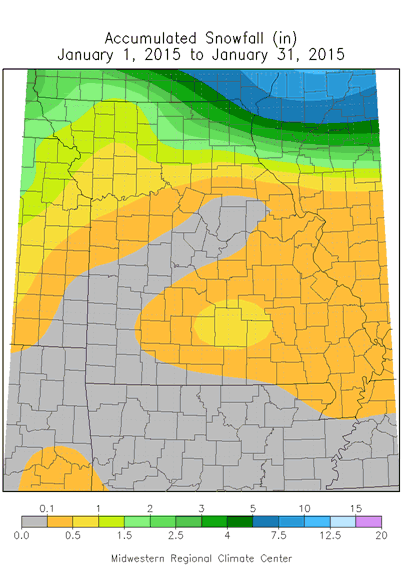
Figure 6.
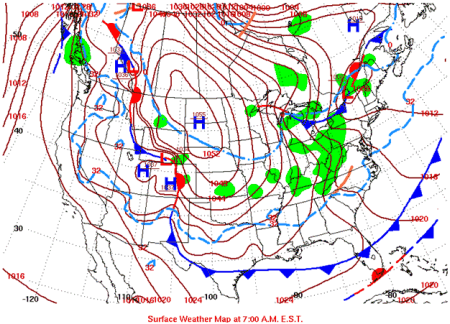
Figure 7. Source: Daily Weather Maps/NOAA
Source: Pat Guinan, 573-882-5908