July 2023 Weather and Its Impacts on Missouri
Dr. Pat Guinan
Climatologist
Extension Associate Professor Emeritus
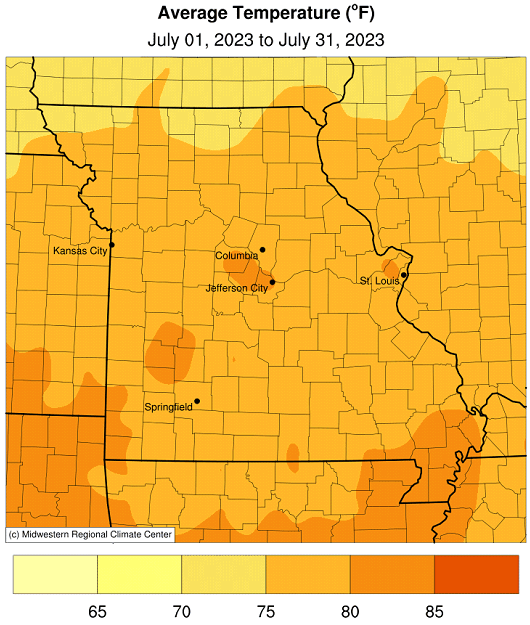
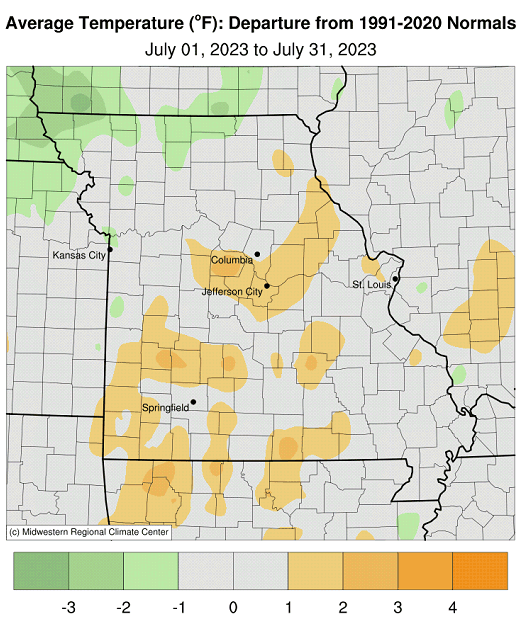
Near to above average temperatures impacted most of Missouri in July, with some locations in northwestern parts of the state reporting departures 1-2 degrees below average. Preliminary data indicated a statewide average temperature of 77.9°F, or 0.2° above the long-term average, Figure 1. Every month this year has been warmer than normal, Figure 2. Maximum and minimum daily July temperatures were above and below average for the month, Figure 3, but some locations reached triple-digits for a few days, toward the beginning and end of the month. Some of the highest maximum temperatures are listed in Table 1.
| MISSOURI TEMPERATURE JULY 2023 | |||
| Station Name* | County | Highest Max Temp (°F) | Date |
| Marble Hill | Bollinger | 106 | 1 |
| Round Spring 2SW | Shannon | 105 | 1 |
| Salem | Dent | 105 | 1 |
| Hannibal Water Works | Marion | 104 | 29 |
| Steffenville | Lewis | 104 | 29 |
| Clarence Cannon Dam | Ralls | 103 | 28 |
| Monroe City | Monroe | 103 | 29 |
| Rosebud | Gasconade | 103 | 1 |
| Boonville | Cooper | 103 | 28 |
| Stockton Dam | Cedar | 103 | 28 |
| *NWS Cooperative Network | |||
| Table 1. | |||
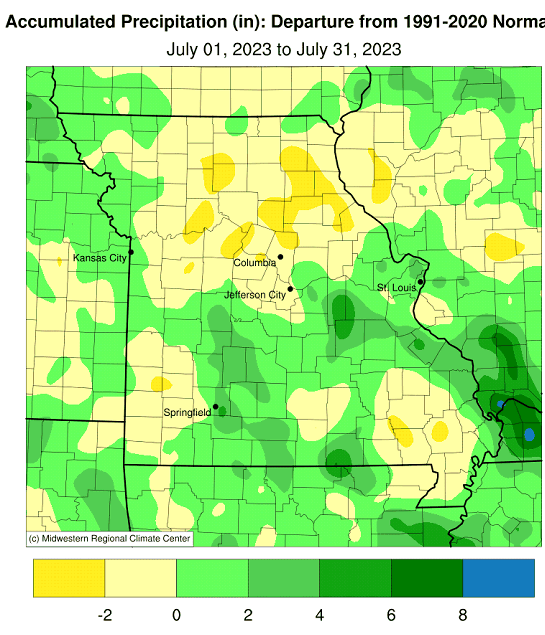
Preliminary data indicate the statewide average July rainfall total was 4.38 inches, or 0.67 inches above the long-term average. It was the fifth consecutive wetter than average July, Figure 4, and first above average month since March, Figure 5.
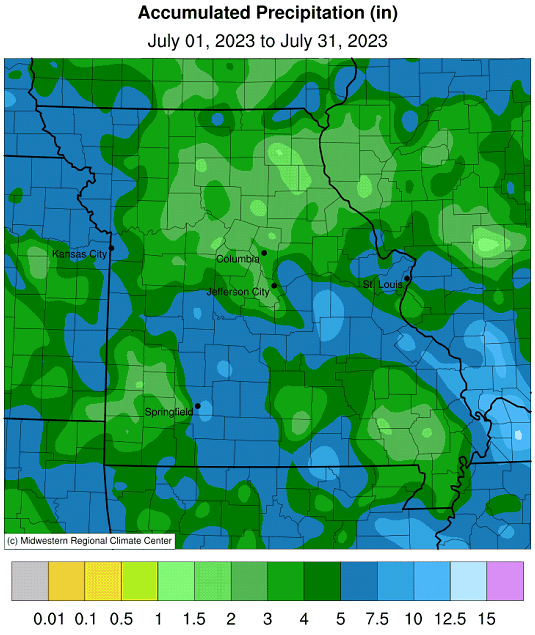
According to radar-estimates, rainfall was variable in Missouri, Figure 6. Heaviest precipitation occurred over portions of northwestern, south central and southeastern sections where 5-7 inches were common. Driest conditions were found across much of northeastern Missouri, and pockets of southwestern and southeastern Missouri where amounts were less than 3-inches. Some of the heaviest and lightest monthly rain gauge reports are listed in Table 2.
| MISSOURI RAINFALL JULY 2023 | |||
| Station Name* | County | Total Rainfall (in.) | |
| Heaviest | |||
| Springfield 4.9 SE | Greene | 11.29 | |
| Rosebud | Gasconade | 10.83 | |
| Myrtle 2.5 WNW | Oregon | 10.75 | |
| Ste. Genevieve 1.25 WSW | Ste. Genevieve | 10.35 | |
| Cuba | Crawford | 10.26 | |
| Lightest | |||
| Williamsville | Wayne | 0.97 | |
| Purdin 1.3 W | Linn | 1.28 | |
| Hallsville 0.5 ENE | Boone | 1.29 | |
| Bloomfield 2.9 S | Stoddard | 1.32 | |
| Steffenville | Lewis | 1.41 | |
| *Rain gauges are from the NWS Cooperative Network and CoCoRaHS | |||
| Table 2. | |||
July was a stormy month with hundreds of severe weather reports documented in Missouri, Figure 7. There were several days with numerous severe thunderstorms impacting the state, including July 1, 12, 14, 16, 17, 29 and 30. One EF-2 tornado (115 mph) was reported on the 24th, in Scott County, near Miner, MO. The tornado had a width of 25-yards and path length of 0.28 miles. It struck a homestead and damaged buildings and trees on the property, including severe damage to a residence. Two people inside the home reported minor injuries from flying debris.
Despite the stormy weather, drought continued to impact much of the Missouri during July with nearly half the state in severe to extreme drought toward the end of the month, Figure 8. Driest conditions were affecting a wide corridor extending from a portion of southwestern Missouri through central and northeastern sections. Many of the impacts were affecting agriculture with numerous reports of crop, pasture, and livestock stress. Hydrological concerns persisted with lowering surface and groundwater supplies.
According to the Missouri Agricultural Statistics Service crop and weather report, from July 30, 2023, 76% of the state reported topsoil moisture supplies in short to very short condition with 24% of the state reporting topsoil moisture in adequate condition. Statewide subsoil condition was reported 77% short to very short, and 23% adequate.
One percent of the corn was reported to be in excellent condition, 24% good, 31% fair, 25% poor and 19% very poor, while soybean was 3% excellent, 25% good, 38% fair, 21% poor and 13% very poor. Pasture was 0% excellent, 6% good, 23% fair, 34% poor and 37% very poor. Half of hay and other roughages were reported very short, 33% short, 16% adequate and 1% surplus. Stock water supplies were 31% very short, 33% short and 36% adequate.
Jump to:
- Figure 1
- Figure 2
- Figure 3
- Figure 4
- Figure 5
- Figure 6
- Figure 7
- Figure 8
- Figure 9
- Figure 10
- Figure 11
- Figure 12
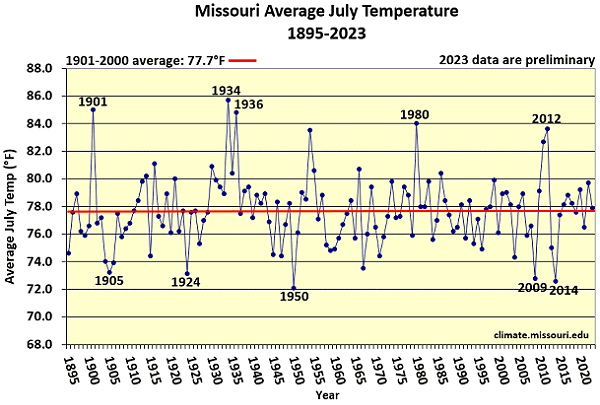
Figure 1.
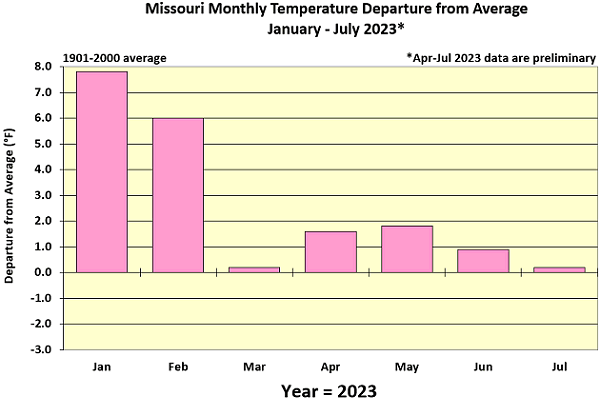
Figure 2.
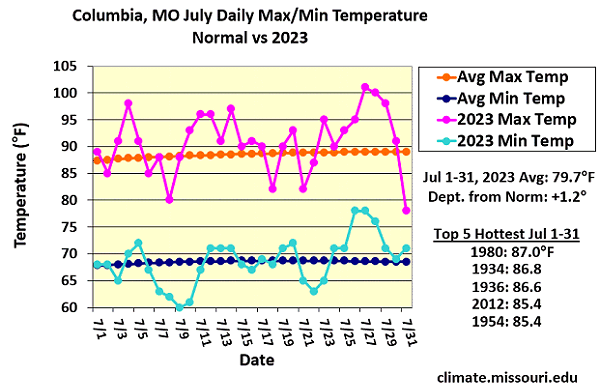
Figure 3.
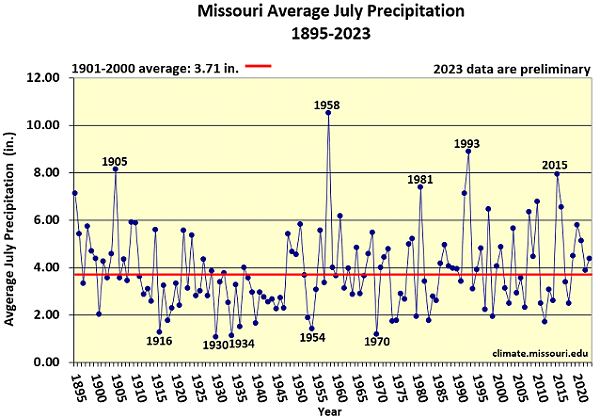
Figure 4.
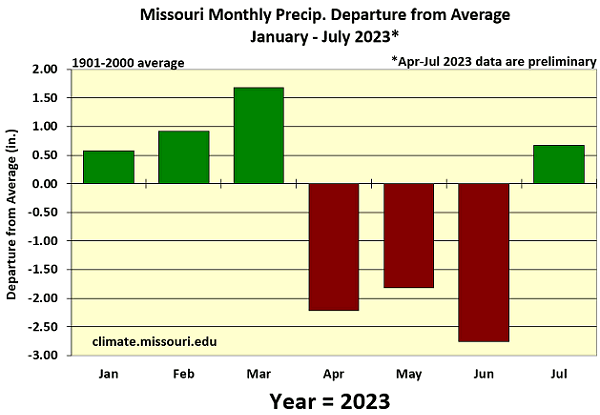
Figure 5.
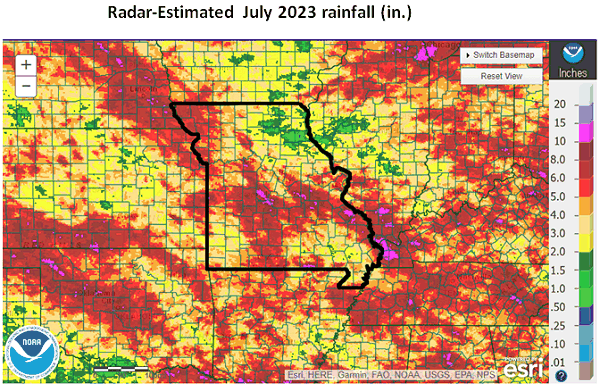
Figure 6.
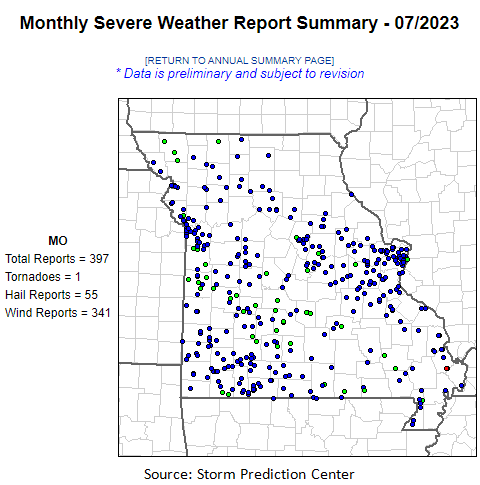
Figure 7.
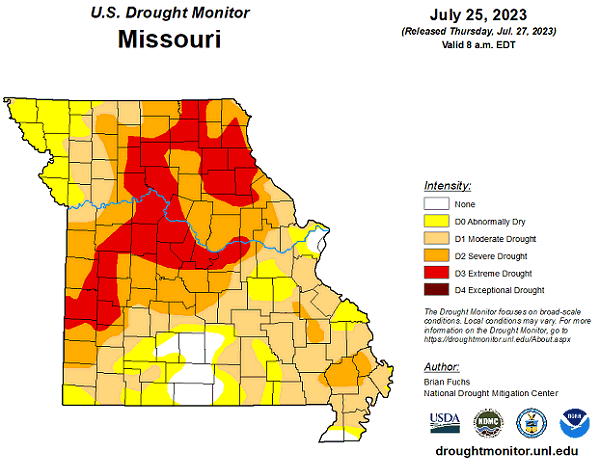
Figure 8.
Source: Dr. Pat Guinan, 573-882-5908


